25. Analytics
This document covers how to use the Hub 2.0 Analytics module to track your site visitors and get detailed info on their interaction with your content using our built-in white label analytics.
If you haven’t set up your WPMU DEV account yet, visit the Hub page, where you can explore the features and see pricing packages.
Already a member? Visit your Hub dashboard to get started.
25.1 Getting Started
Copy chapter anchor to clipboardTo access the Analytics section for a site, from the Hub 2.0 My Sites page, click on the site you would like to manage and click on the Analytics option in the site manager menu.
If you haven’t set up Analytics yet for your site, click the Activate button.
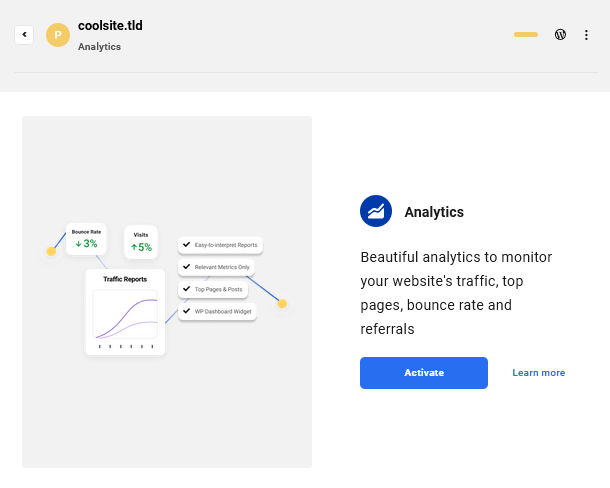
This will activate the Analytics feature in the WPMU DEV Dashboard plugin which should already be installed on your site. The same analytics data will also be available in your site admin and in Reports you create from your Hub. For more on that, see the Analytics chapter in the WPMU DEV Dashboard plugin usage docs.
Note that when activated in a multisite installation, analytics data will be presented for the entire multisite.
If you would like a full breakdown of everything that The Hub has to offer in terms of analytics, check out our brief article on Analytics in The Hub.
25.2 Statistics
Copy chapter anchor to clipboardGraph
The Statistics graph displays visits to your site for the date range selected at the top of the graph. You can select to display data for the previous 1, 7, 30 or 90 days.
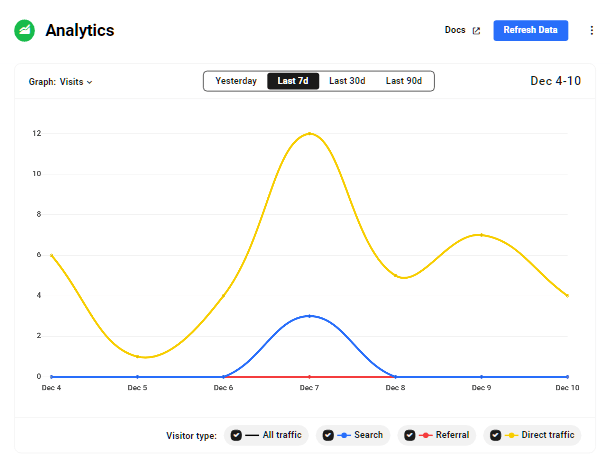
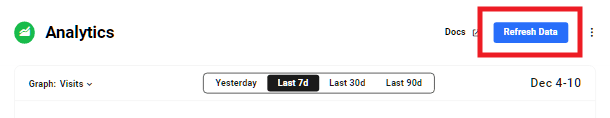
If the displayed data appears out of sync, you can click the Refresh Data button at any time to ensure it’s current.
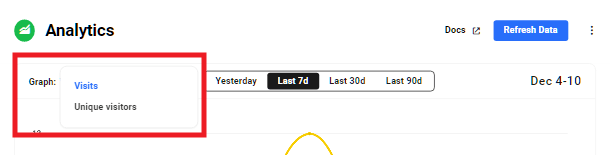
Click the Graph dropdown at top-left to select to display either the total of all Visits or only Unique Visitors in the selected date range.
Hover your mouse over any point in the graph to view the total number of visits for that day according to the visitor type selected above.
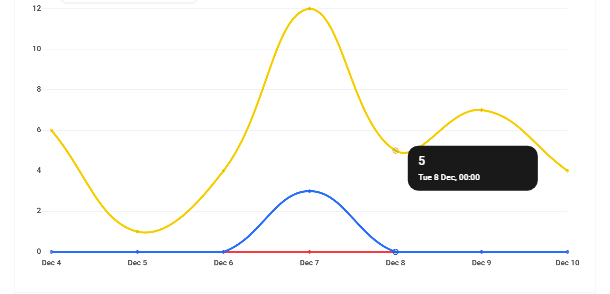
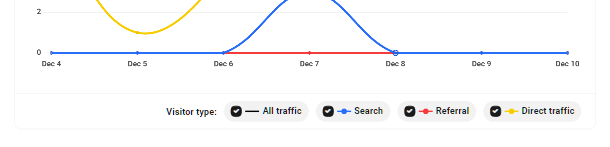
At the bottom of the graph, you can filter the display if needed to display either All traffic, or any combination of just Search, Referral or Direct traffic.
Page Details
The page details section beneath the graph lists all site pages visited during the date range selected at the top of the graph.
The percentage value below each metric represents the relative increase or decrease by comparing the selected period to the same prior period. For example, if you’re viewing the data from the last 7 days (e.g., Mar 8-14), it will compare performance between this date range and the 7 days before it (e.g., Mar 1-7).
These percentage values are denoted by arrows and are color-coded to help you spot any increase or drop in the different metrics.
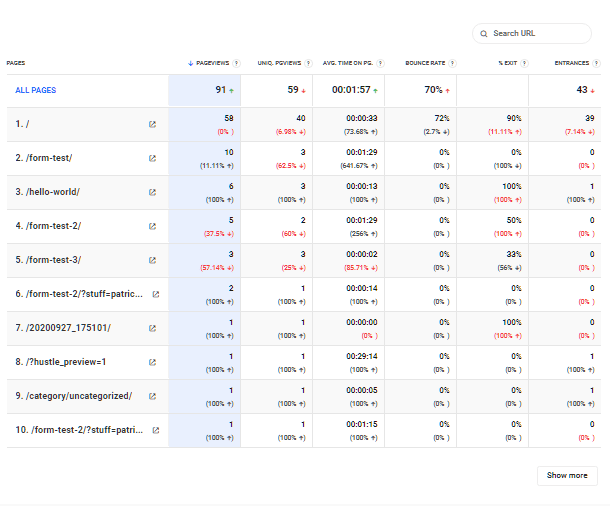
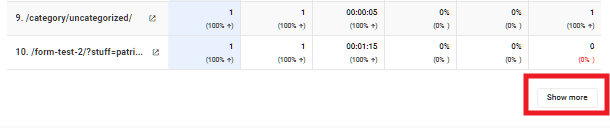
By default, the list displays only the top ten results. To view more results, click the Show More button at the bottom-right of the details section.
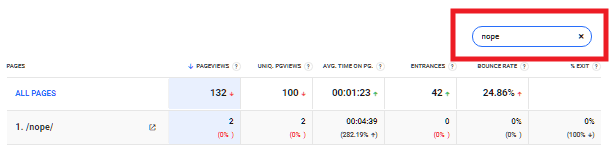
If you need to view statistics for specific page(s), start typing the page name in the Search box at top-right of the details section, and the list will dynamically update to display only those pages corresponding to your search term.
By default, the pages are listed according to Pageviews, in descending order. You can switch that to ascending order by clicking on the column header.
If you prefer to view visited pages ordered according to any other displayed metric, simply click the appropriate column header. The column of the metric selected will be highlighted in blue.
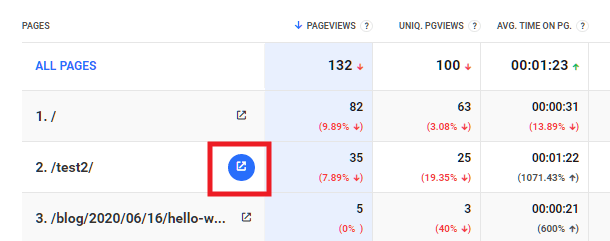
Each item in the list also has a handy link to the corresponding page on your site. Click any one to open that page in a new tab.
25.3 Settings
Copy chapter anchor to clipboardThe settings tab enables you to configure which metrics should appear on the Statistics screen. Note that this only affects the display here in your Hub, not in your WPMU DEV Dashboard or Hub Reports.
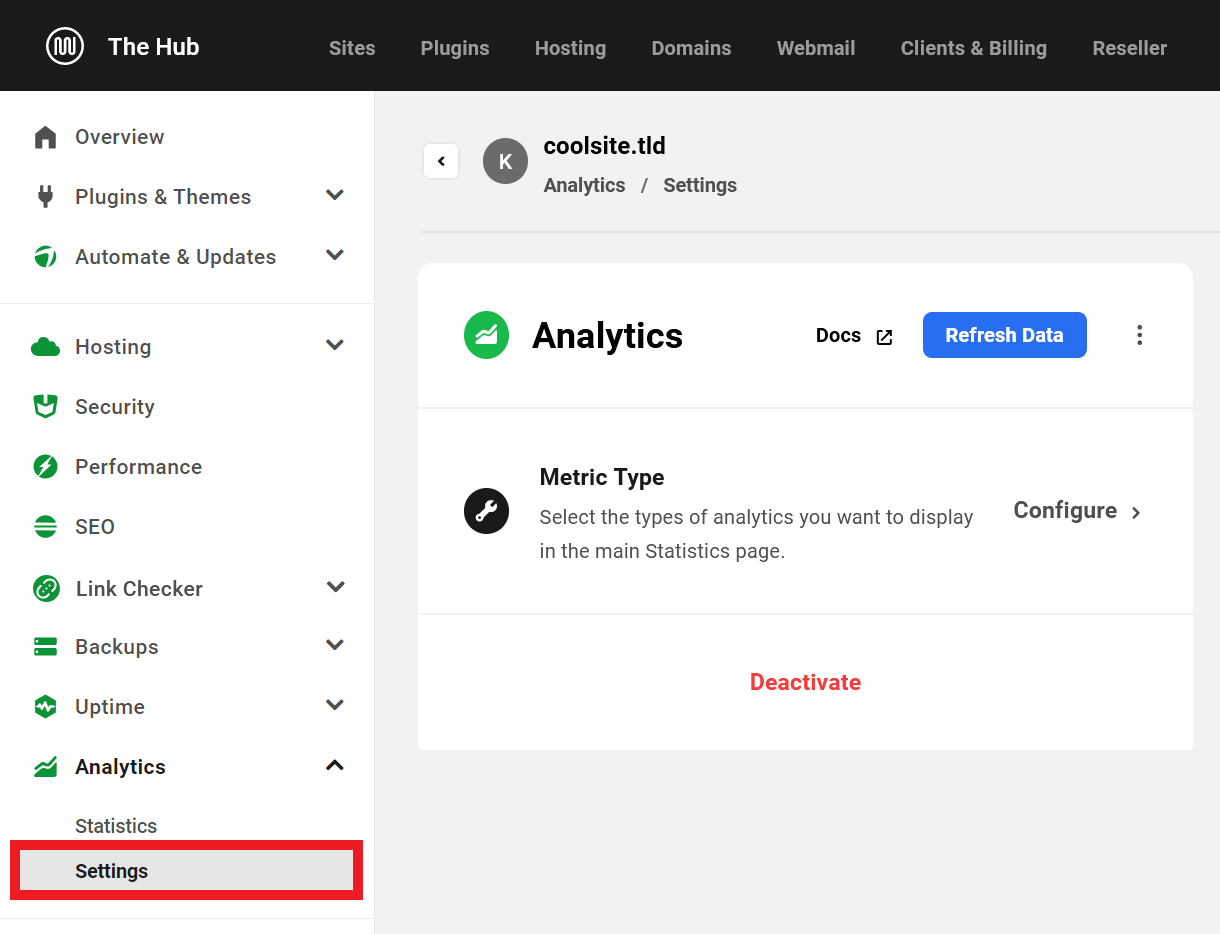
Click the Configure link to pop open a modal where you can enable/disable any available metric. Enabled metrics will be highlighted in blue.
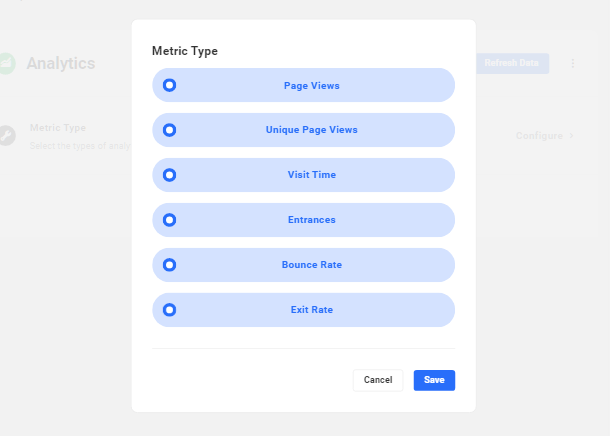
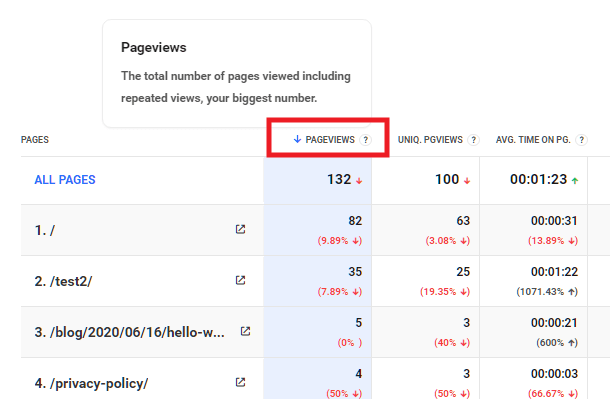
- Page Views – This is the total number of pages viewed, including repeated views.
- Unique Page Views – The number of visits during which a page was viewed at least once.
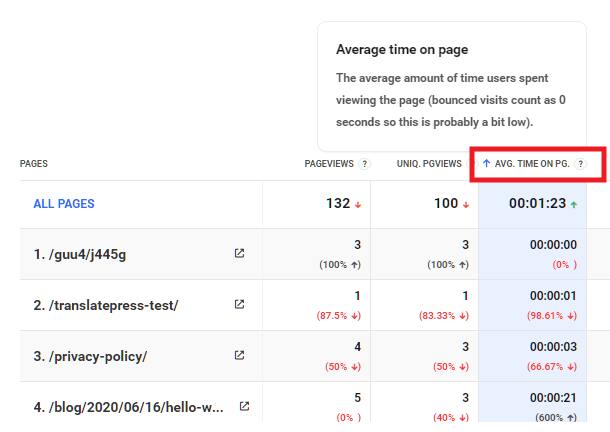
- Visit Time – The average amount of time users spent viewing a page.
- Entrances – The number of times visitors entered your site through this page, from any source (search, direct, referral, etc.).
- Bounce Rate – The percentage of single-page sessions with no interaction.
- Exit Rate – The percentage of visitors who viewed a page as part of an overall visit and then exited your site from that page.
If you wish to view your site statistics in your site admin, click the ellipsis icon to open its options, then click the View in WP-Admin link to open your site’s Dashboard screen in a new tab. Stats will be displayed there in an Analytics widget.
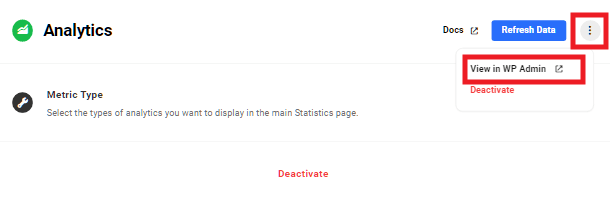
If you deactivate Analytics here by clicking the Deactivate link, that will deactivate analytics in the WPMU DEV Dashboard on your site, and analytics will no longer be available there, here in your Hub, or in Hub Reports.
25.4 Get Support
Copy chapter anchor to clipboardIf you still have questions or need assistance after reading this document, please don’t hesitate to contact our support superheroes using the available options under the Support tab in your Hub or via the Support tab in your WPMU DEV Dashboard.
