9. Logs
This usage guide explains how to view and use the Logs available with your WPMU DEV Hosting account.
Visit your hosting dashboard to get started. More on getting started with WPMU DEV hosting can be found here.
Quickly navigate this usage guide from the navigation index in the sidebar.
If you haven’t set up your WPMU DEV hosting account yet, visit the hosting page, where you can explore the features and see pricing packages.
Note that the Web Application Firewall (WAF), and consequently the WAF logs, are not available for sites on the Quantum plan. See Quantum Plan Restrictions for details.
9.1 Getting Started
Copy chapter anchor to clipboardThe Logs for any WPMU DEV hosted site are located under the Logs tab of that site’s Hosting manager.
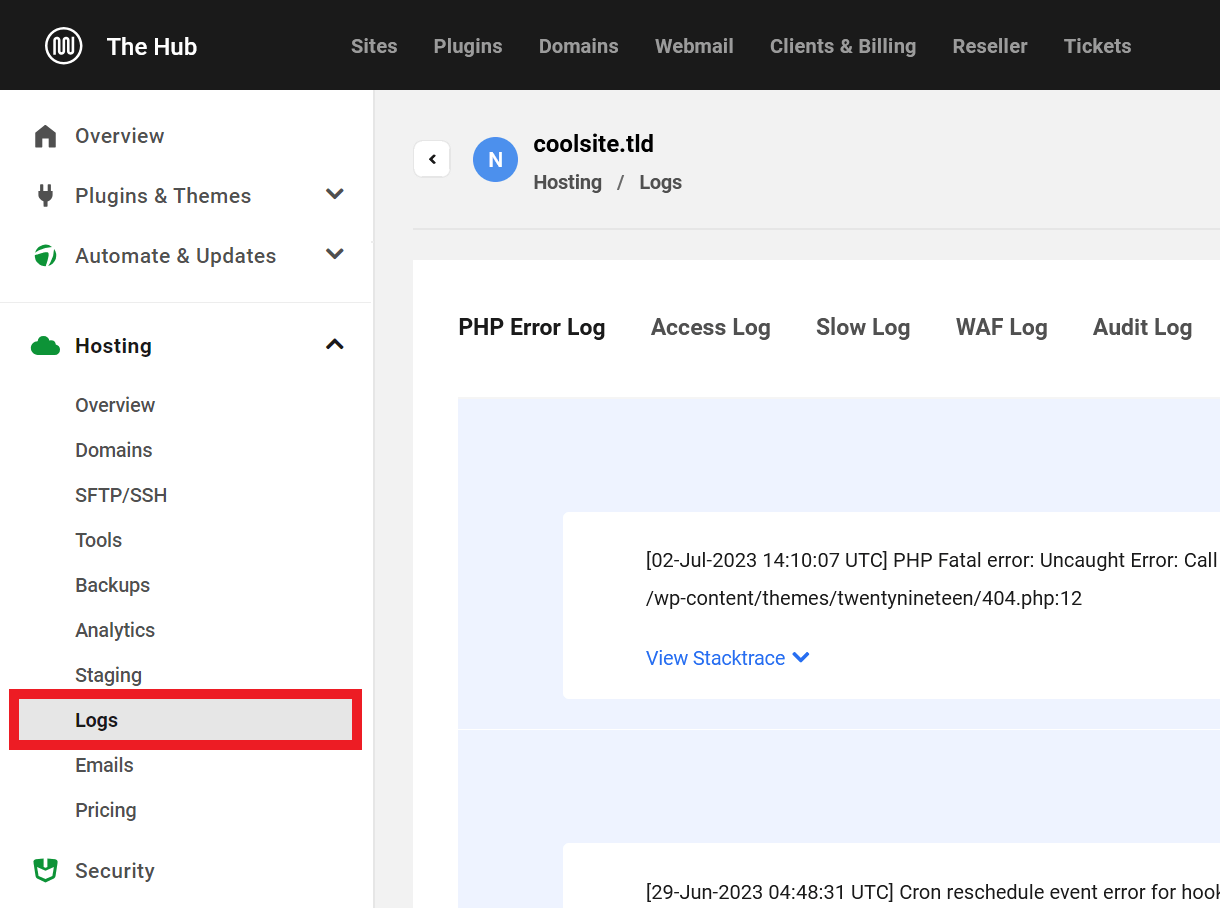
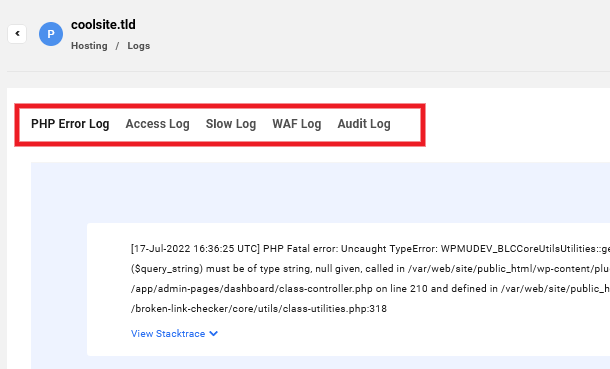
There are five log types, each with its own tab:
- PHP Error Log
- Access Log
- Slow Log
- WAF Log
- Audit Log
9.2 Logs Overview
Copy chapter anchor to clipboardThe Logs menu allows you to navigate between the available reports.
Use the Production / Staging toggle to switch between Production and Staging logs. Click the Refresh button to view the most up-to-date information. Click the Download button to download the logs you need (see below for details).
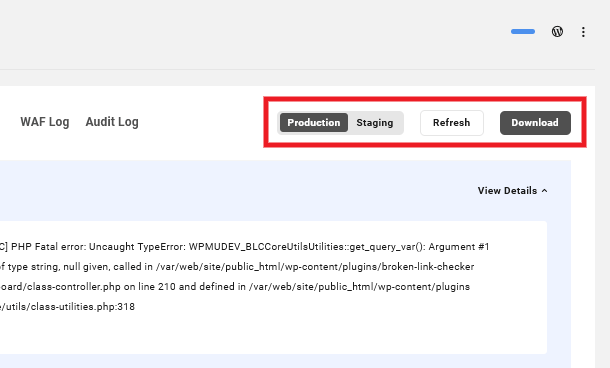
Logs show the last 100 entries from the selected log. WPMU DEV stores logs for the past 7-days. You can access all available logs using the download module or view them over SSH/SFTP as described below in the Download section.
9.2.1 Download
Link to chapter 2Clicking the Download button opens the Export Log Files module, where you can configure a log report using data from the past seven days.
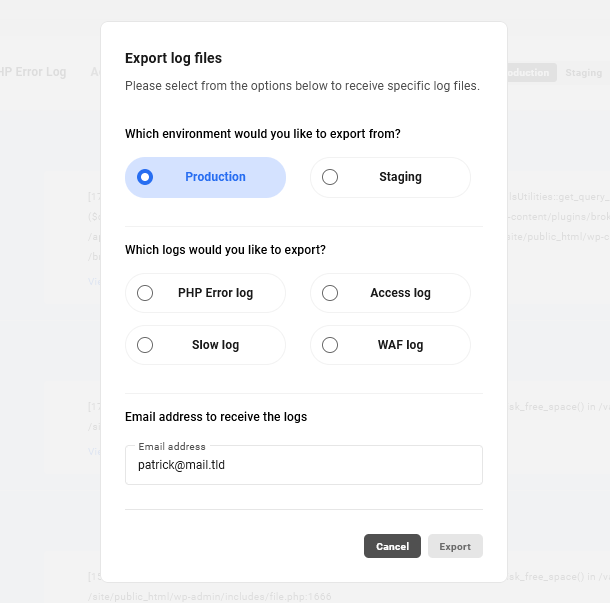
Choose the environment– production or staging– for which you want to create a report, and then the logs you wish to include in that report.
Add the email address to which the report should be sent. Multiple email addresses, separated by commas, can be added.
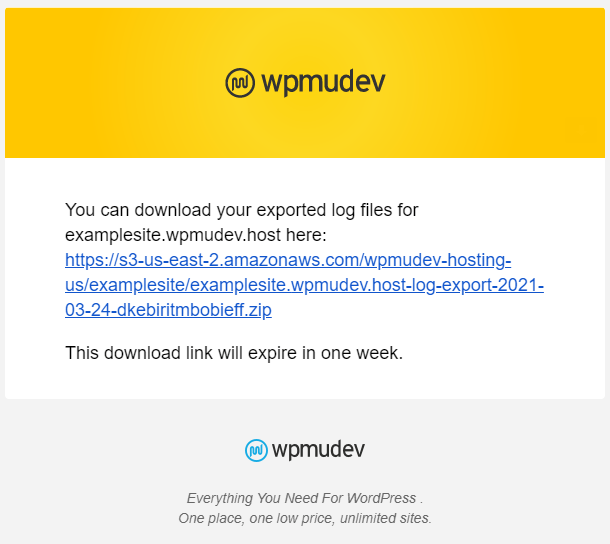
Click Export to gather and export your selected reports or Cancel to close without sending. When the report is complete, a success notice will appear with a download link.

An email containing a download link also will be sent to the included email addresses. Click that link to download the report.
9.3 PHP Error Log
Copy chapter anchor to clipboardThe PHP Error log tracks error messages for wrong syntax or wrong logic.
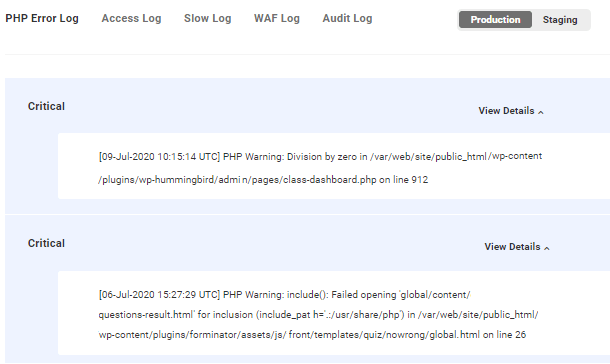
Here is a list of PHP Errors tracked in the PHP Error log.
- E_ERROR – This is a fatal error that is causing scripts to fail
- E_WARNING – This is a run-time warning that does not cause your scripts to fail
- E_PARSE – Compile-time parse error
- E_CORE_ERROR – A fatal error that occurs during installation
- E_CORE_WARNING – Warnings that occur during the initial startup of PHP
- E_COMPILE_ERROR – Fatal compile-time error is caused when there is a problem with your script
- E_USER_ERROR – Error message generated by the user
- E_USER_WARNING – Warning message generated by the user
- E_USER_NOTICE – Notice message generated by the user
- E_STRICT – Run-time notice
- E_RECOVERABLE_ERROR – A a potentially dangerous fatal error that can be caught and fixed
If you are not familiar with PHP errors or need help resolving issues on your site, contact our 24/7 live support.
The PHP Error log rotates if the log file size exceeds 10MB, the previous entries are archived and the latest entries are displayed in the hub.
Use the following file location to search the PHP Error log files via SSH
~/site/logs/php_errors.log
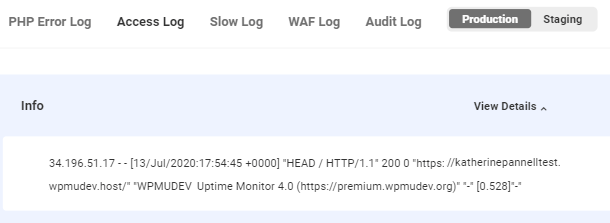
9.4 Access Log
Copy chapter anchor to clipboardThe access log is a list of requests for individual files people or bots have requested from your website. This log includes:
- IP address
- Date and time
- Content requested
- Browser and version performing a request
The Access log rotates every 7 days and the previous entries are deleted.
Use the following file location to search the Access log files via SSH
~/site/logs/access.log
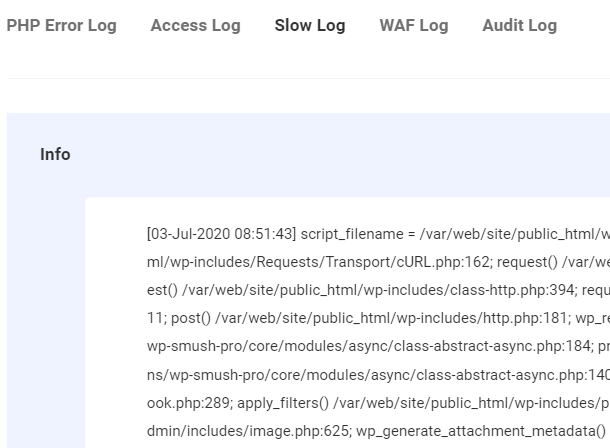
9.5 Slow Log
Copy chapter anchor to clipboardThe Slow Log tracks queries that exceed a predefined time limit making it easy to find inefficient or time-consuming queries. For WPMU DEV hosting the predefined time is 30 seconds.
The log flags the date, time, and script filename.
The Slow log rotates if the log file size exceeds 10MB, the previous entries are archived and the latest entries are displayed in the hub.
Use the following file location to search the Slow log files via SSH
~/site/logs/php_slow.log
9.6 WAF Log
Copy chapter anchor to clipboardWeb Application Firewall (WAF) logs are available if the WAF is activated, which can be accomplished under the tools tab.
When active, the WPMU DEV WAF has a custom set of rules that sits before traffic hits your WordPress site to help monitor and filter out attacks and malicious traffic.
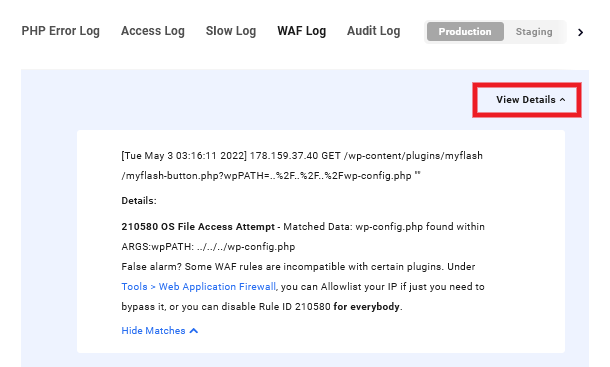
The WAF Log includes:
- Date and Time of flag
- IP address
- Requested file
- Details about the matched rule – In this section, you can click the Tools > Web Application Firewall link to pop open the WAF Firewall settings. There, you can add your IP address to the IP Allowlist field or disable the rule by pasting the rule ID in the Disabled Rule Ids field.
For more information about configuring your WAF, check our Web Application Firewall (WAF) documentation.
The WAF log rotates if the log file size exceeds 10MB, the previous entries are archived and the latest entries are displayed in the hub.
Use the following file location to search the WAF log files via SSH
~/site/logs/waf.log
9.7 Audit Log
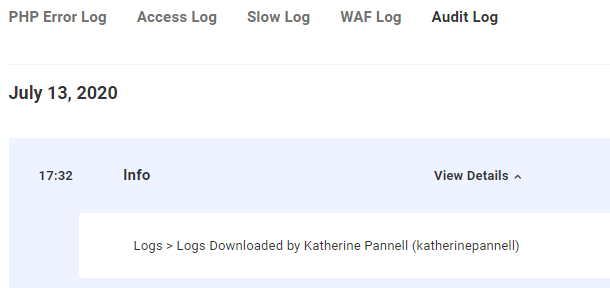
Copy chapter anchor to clipboardThe Audit Log is a list of every action or change made to your website hosting.
This includes a note with the action and the user that performed the action.
9.8 Get Support
Copy chapter anchor to clipboardIf you still have questions or need assistance after reading this document, please don’t hesitate to contact our support superheroes using the available options under the Support tab in your Hub or via the Support tab in your WPMU DEV Dashboard.
