10. Beehive
This guide explains how to use Beehive to bring Google Analytics reports right to your site’s dashboard and, if you want, to the dashboards of every site in your multisite network.
Beehive requires PHP 7.4.33 or greater. See WPMU DEV Minimum Requirements for details.
Once Beehive is installed and activated, refer to this guide for assistance with configuration. Use the index on the left to quickly access guidance on specific features.
If you haven’t installed Beehive yet, then you should visit the Beehive page where you can explore the plugin’s many features.
Upon activation or when certain features are configured, this plugin may add cookies to the user’s browser, store personal information in your database, or integrate with 3rd-party applications. You may need to disclose this information to your site visitors. For details, see Our Plugins in our privacy policy documentation.
If you are using the Complianz plugin, you’ll be happy to know that Beehive integrates with it out of the box when you configure that plugin on your site.
You need a Google Analytics account, which is free, to properly configure Beehive. If you need to create an account, the Get Google Analytics section of this guide will have you up to speed in minutes.
In a world where there are several great WordPress analytics tools on offer, it can be tricky to choose the right one or ones for your particular needs. For a quick guide to figuring out which tools suit your site, check out our blog on What Kind of Analytics Tools You Should Use.
10.1 Quick Setup
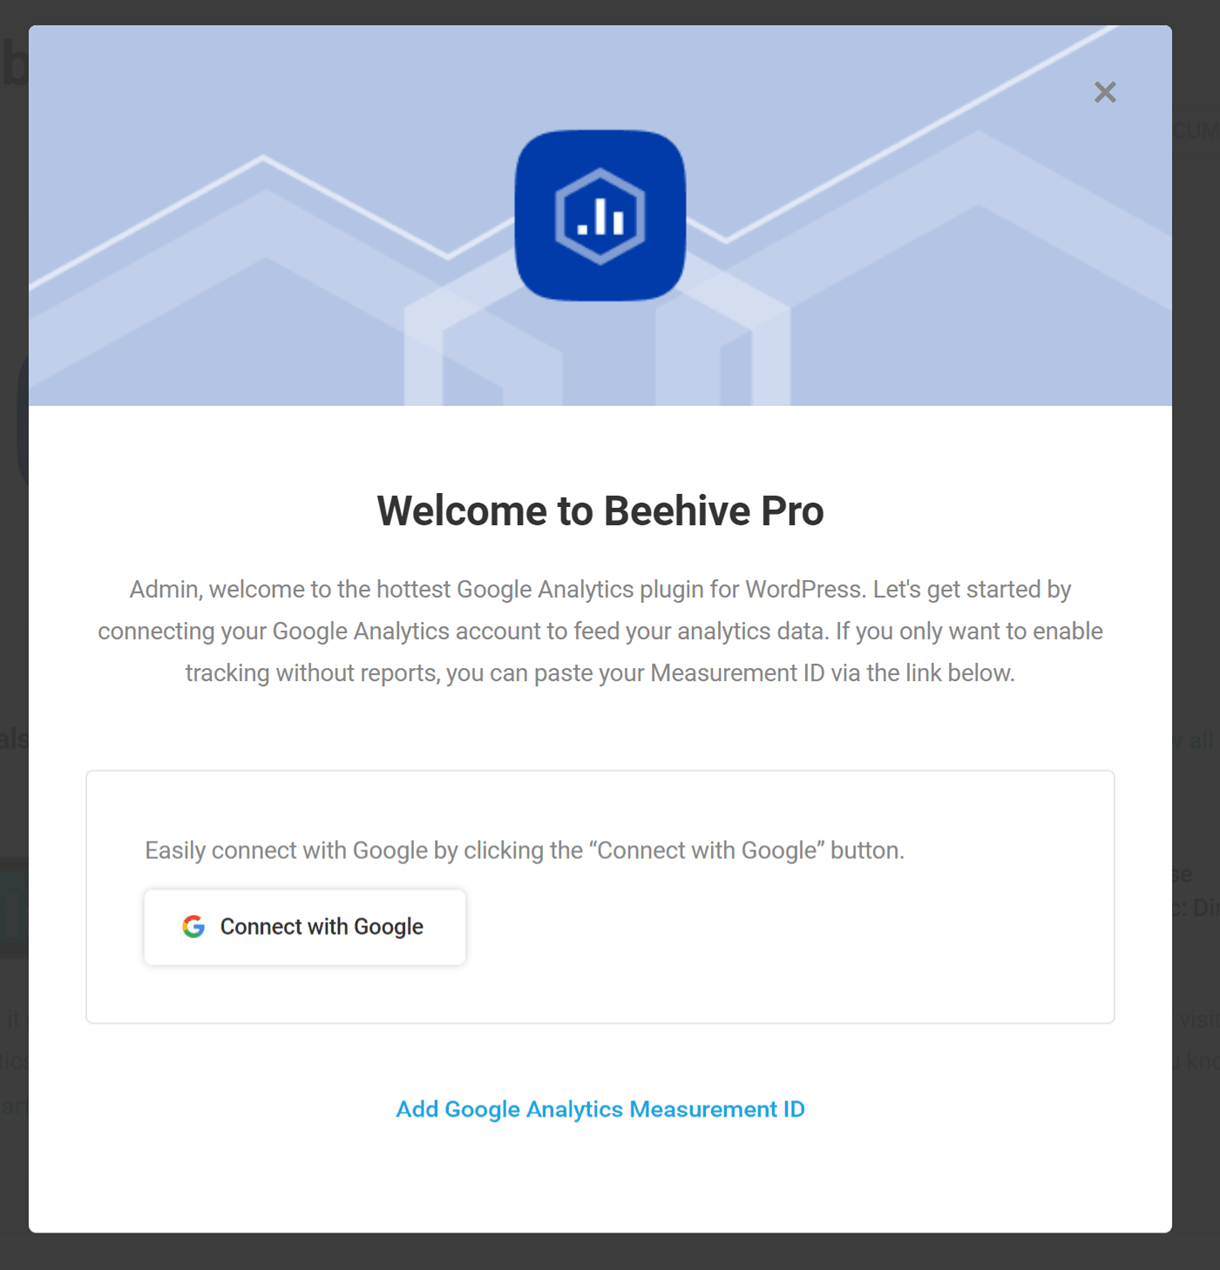
Copy chapter anchor to clipboardThe Welcome to Beehive Quick Setup modal appears the first time Beehive is activated, and we encourage novice users to follow it. It offers two simple ways to connect Beehive to Google Analytics.
- Connect with Google – This is the simplest connection method that utilizes Google’s shared API to display tracking statistics in your site’s wp-admin.
- Add Google Analytics Measurement ID – Adding only a Measurement ID allows data to be sent to a property within a Google Analytics account, but that data can only be viewed in Google Analytics and will not be available in the wp-admin of your site.
Connect With Google (Quick Setup)
The process of connecting with Google’s shared API in the Quick Setup is very similar to when connecting with that method from the Accounts screen in Beehive. But the Quick Setup will walk you through a few additional configurations to ensure everything is set up correctly.
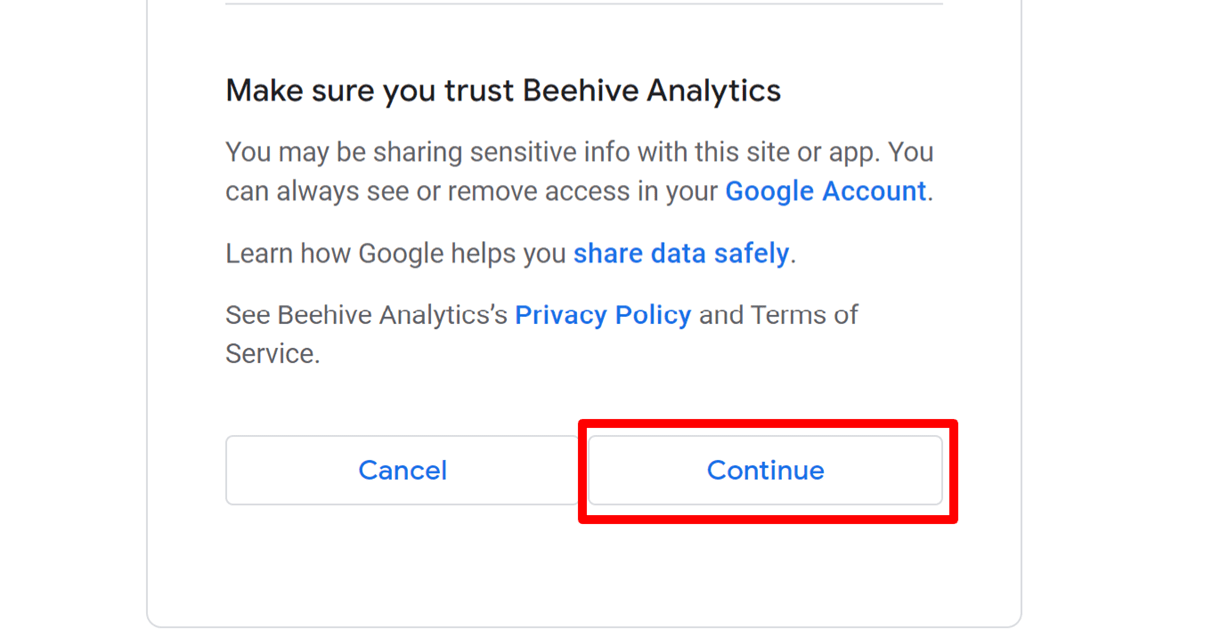
When you click the Connect with Google button, you’ll be prompted to select the Google account you wish to use to connect Beehive to Google Analytics.
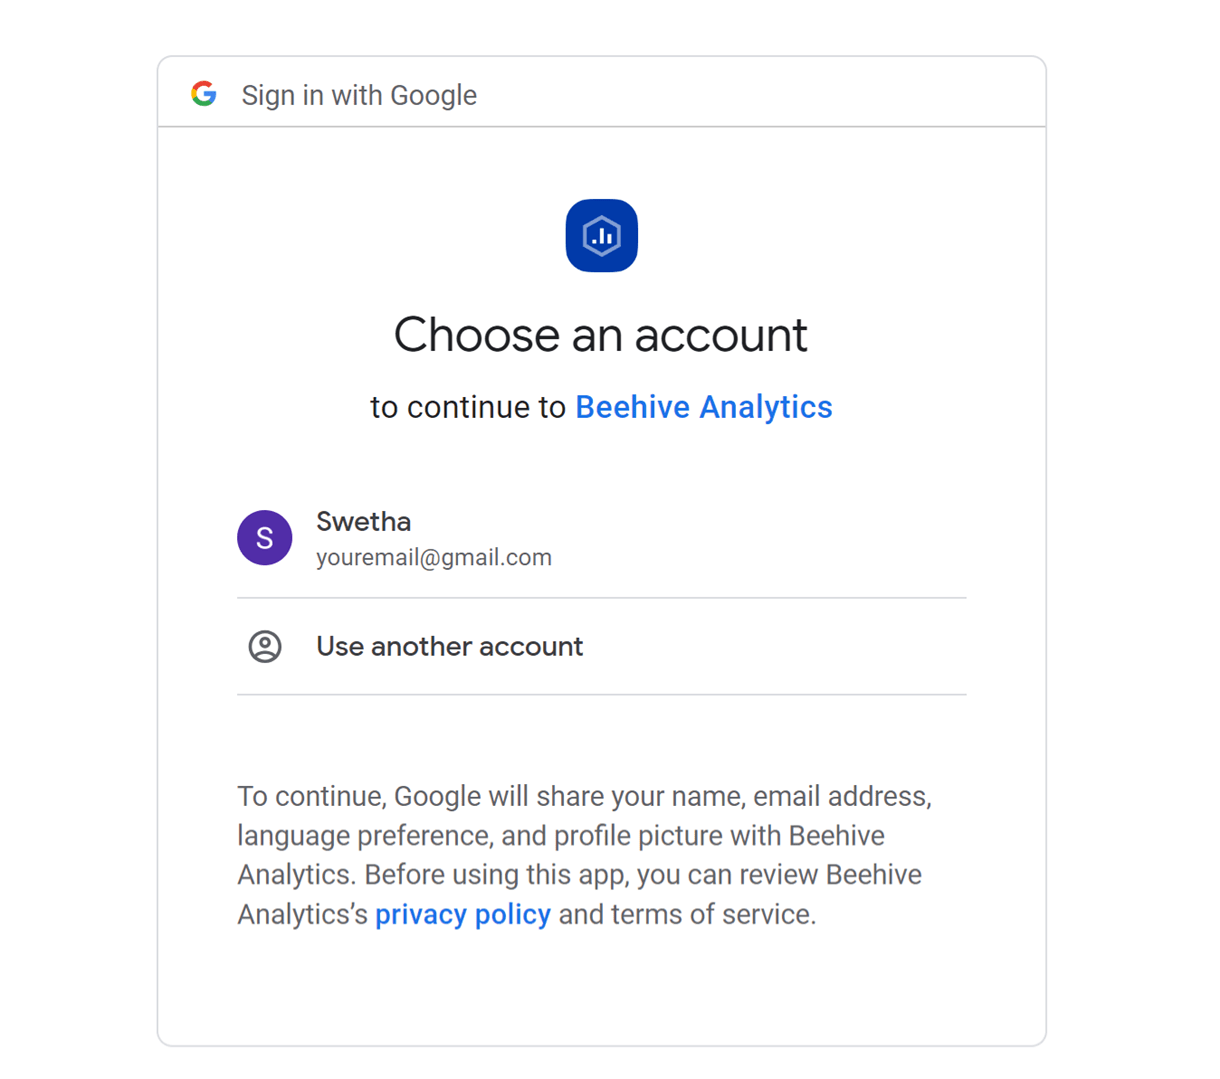
Be sure to check the box to allow Beehive to See and download your Google Analytics data.

Then click the Continue button at the bottom.
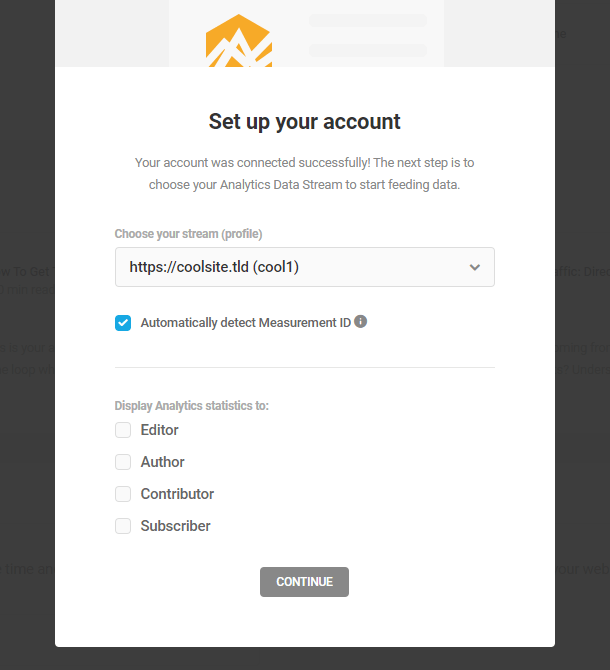
You’ll then be prompted to select the Data Stream you wish to use for this site from the Choose your stream dropdown.
Check the box to Automatically detect the Measurement ID associated with that data stream so site data can be sent to your Analytics account.
You can also select additional user roles to Display analytics statistics to in your site admin. Users with the Administrator role have this capability by default so that role is not shown here.
Click the Continue button when you’re ready.
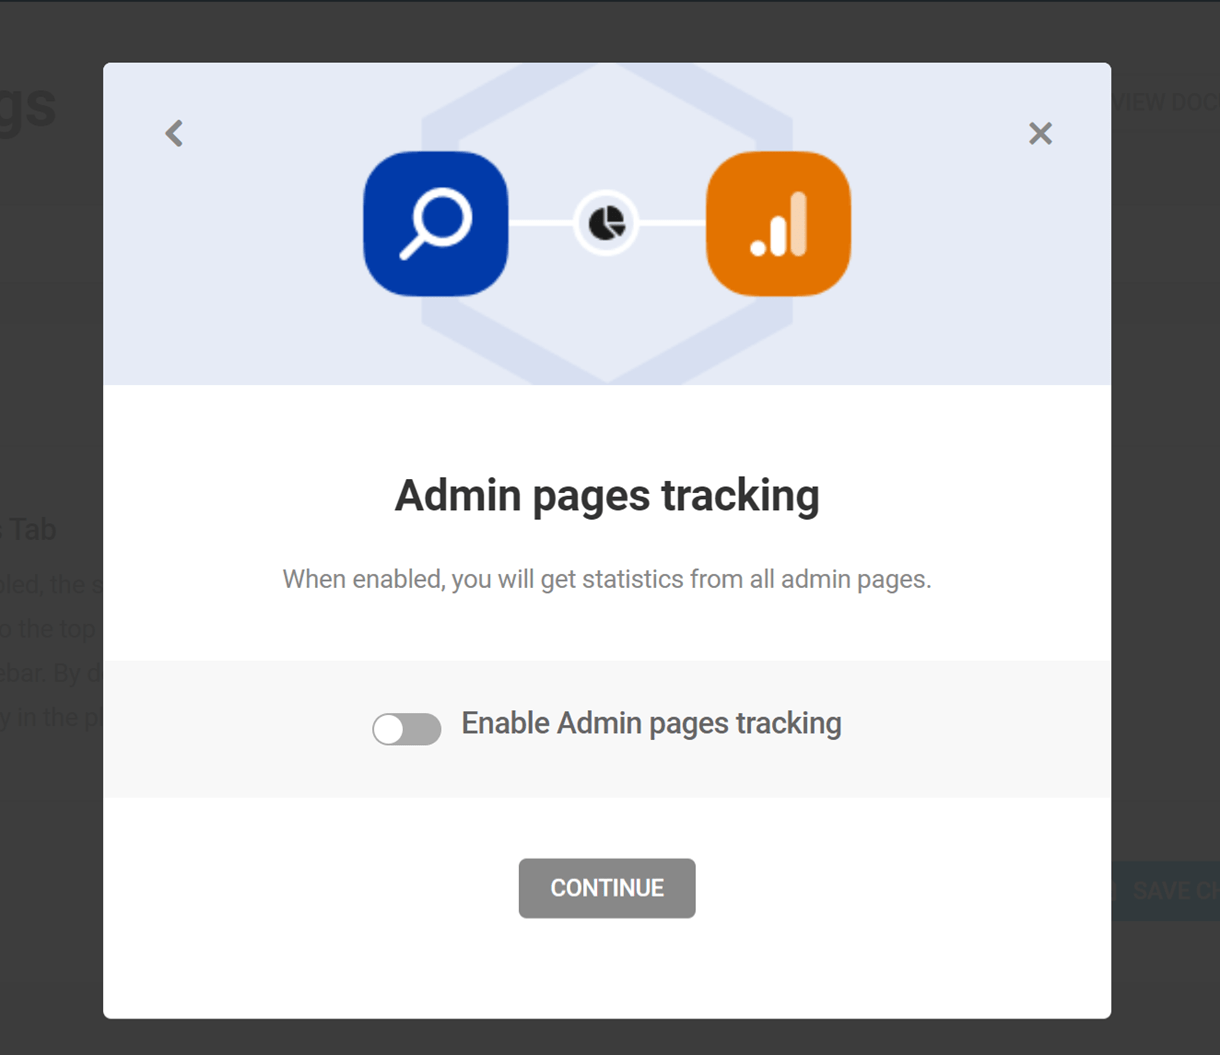
Finally, select whether you want to enable Admin Pages Tracking. Toggle on that option if you do.
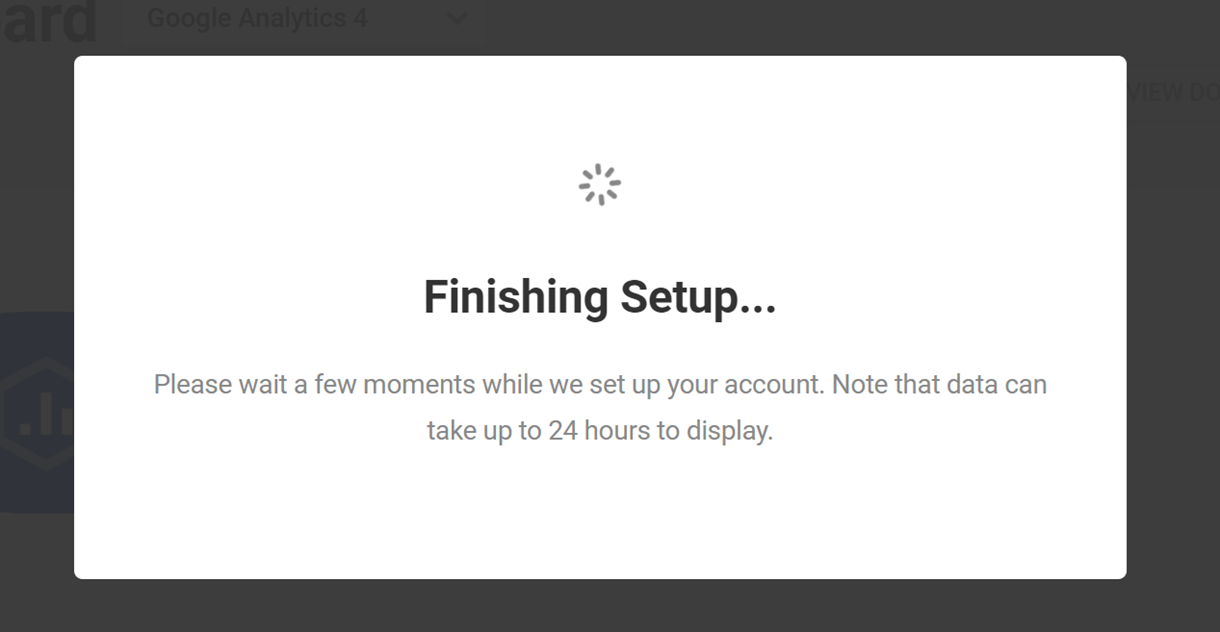
And that’s it. Your Google Analytics 4 data stream is now connected to Beehive, and you should begin seeing analytics data in your site admin and in your Google Analytics account within the next 24 hours.
Add Google Analytics Measurement ID (Quick Setup)
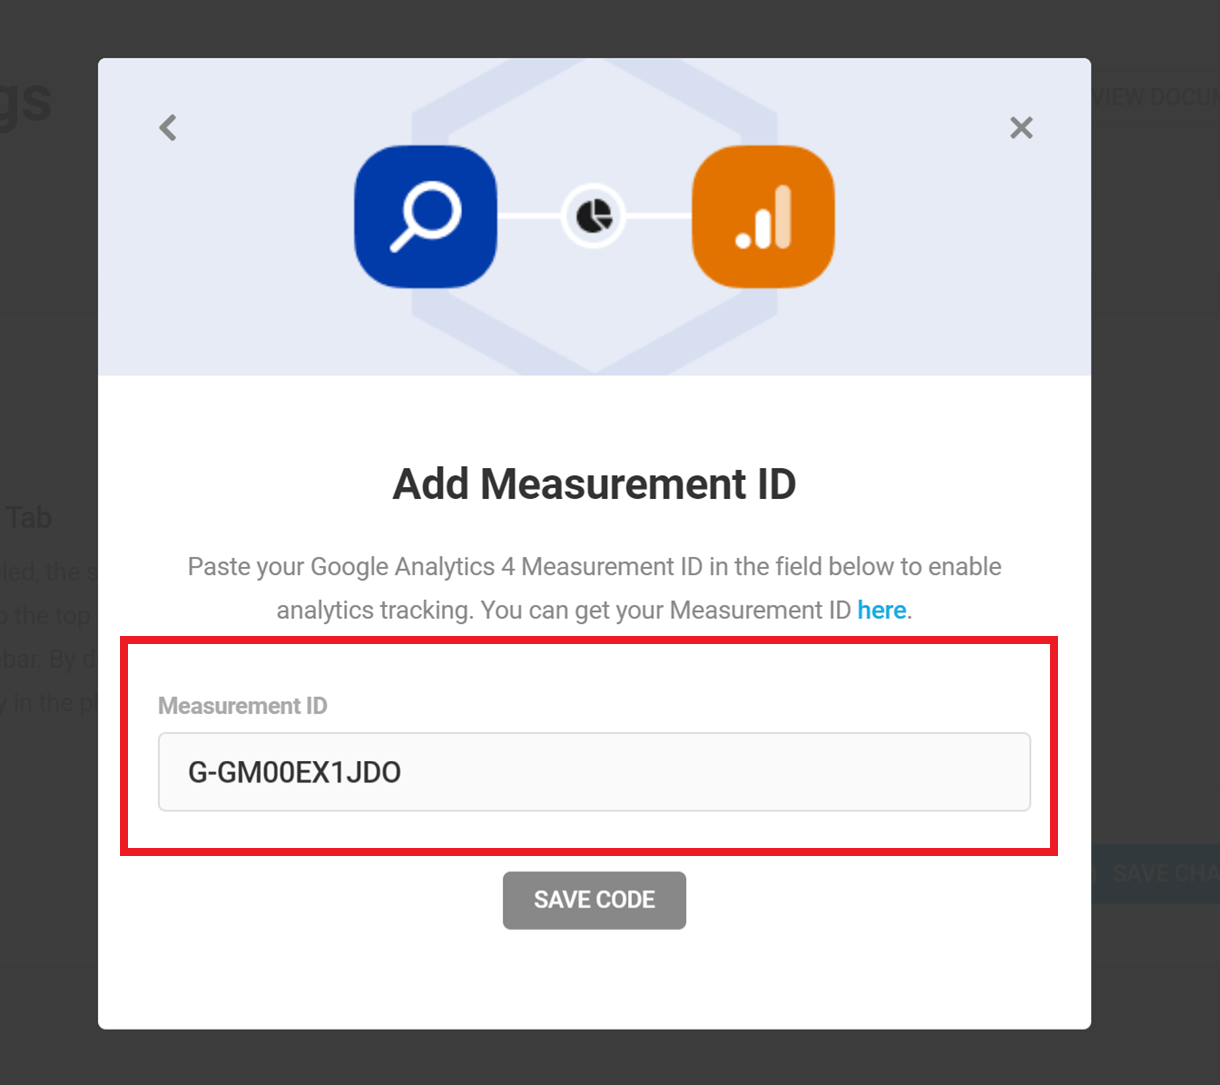
You can use this method if you don’t need to see analytics data in your site admin, and just need to send data to your Google Analytics account.
When you click the Add Google Analytics Measurement ID link, you’ll be prompted to enter the Measurement ID of the data stream you want to use for your site, then click the Save Code button.
See the Measurement ID section in the Get Google Analytics chapter for help locating that info if needed.
You’ll then be prompted to choose whether you want to enable Admin Pages Tracking. Toggle on that option if you do.
And that’s it. Your Google Analytics 4 Measurement ID will be output in the head of every page of your site, and you should begin seeing data in your Google Analytics account within 24 hours.
Additional Connection Info
In addition to the two connection methods offered in the Quick Setup here, you have the option to use your own Google API Project if you are an experienced user of Google tools. Just click the [X] at the top-right of the Quick Setup modal to skip it, and go to the Set up API Project section of this guide to see how to configure that.
You do of course need a Google Analytics account to use any of these connection methods. If you do not have an account already, see the Get Google Analytics section of this guide for help with that if needed.
Note that regardless of the connection method you choose, access to Beehive can be limited to specific users and user roles if you are concerned about which of them have access to a site’s statistics. See the Settings > Permissions chapter below for more info.
10.2 Beehive Dashboard
Copy chapter anchor to clipboardThe Dashboard statistics become available after Beehive is connected to Google Analytics and consists of the Overview, the Statistics quick access panel, and the Google Tag Manager module. Admins, particularly those managing multiple sites, can use the Dashboard to get a quick big picture view of site activity over time.
Wanting to really take advantage of everything that Beehive has to offer? Check out our blog on how to Get The Most Out Of Beehive.
Use the View Documentation button to access Beehive usage documentation (this document).
Overview
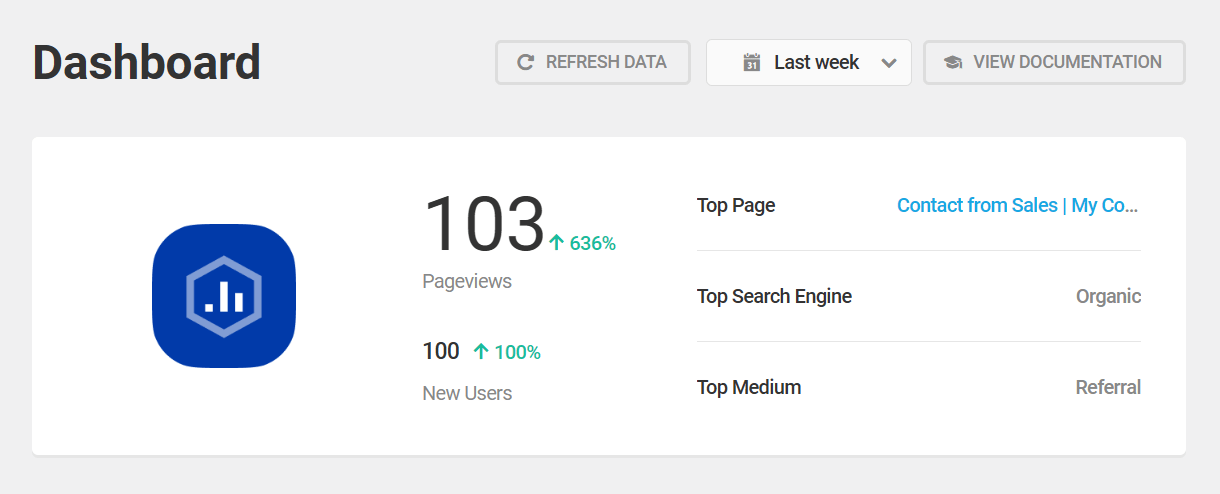
The Overview panel provides a snapshot of a site’s traffic stats for a specified period of time. Overview elements include:
- Time frame filter – This is located next to the View Documentation button. Use the filter to display traffic and activity stats for a day, for years or any time frame in between, using the custom range option. The selected time frame will modify the stats displayed in both the Overview and Statistics panels.
- Pageviews – Displays the number of unique page views during the selected time frame, along with the percentage change during that same period.
- New Users – The number of new users during the selected time frame, along with the percentage change during that same period.
- Top Page – The most visited page during the selected time frame.
- Top Search Engine – The search engine that generated the most traffic for a site during the selected time frame.
- Top Medium – The path that generated the most traffic (direct, organic search, referrals, paid, etc.) during the selected time frame.
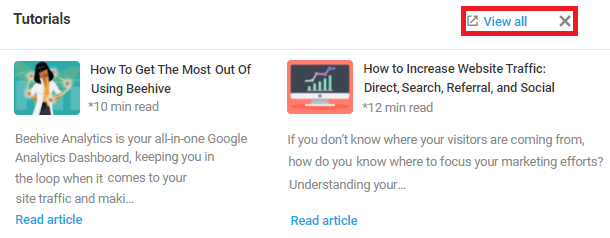
Tutorials
The tutorials module gives you easy access to all the relevant tutorial blogs. Click read more to navigate to the specific article or click View all to jump to the main Beehive tutorial page. You can also click the x icon to remove the tutorials module – the tutorials will always be available in the Tutorials tab.
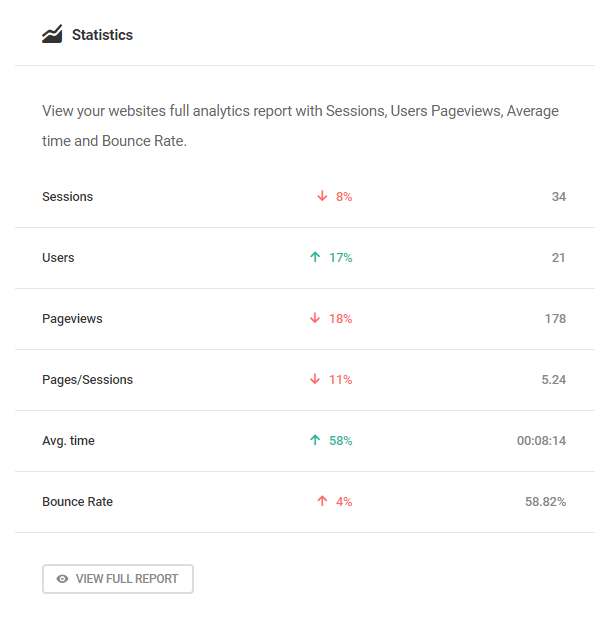
Statistics
This widget gives you a snapshot of your statistics and acts as a quick-access panel to view your full analytics report. Click the View Full Report button to learn more about all of your analytics.
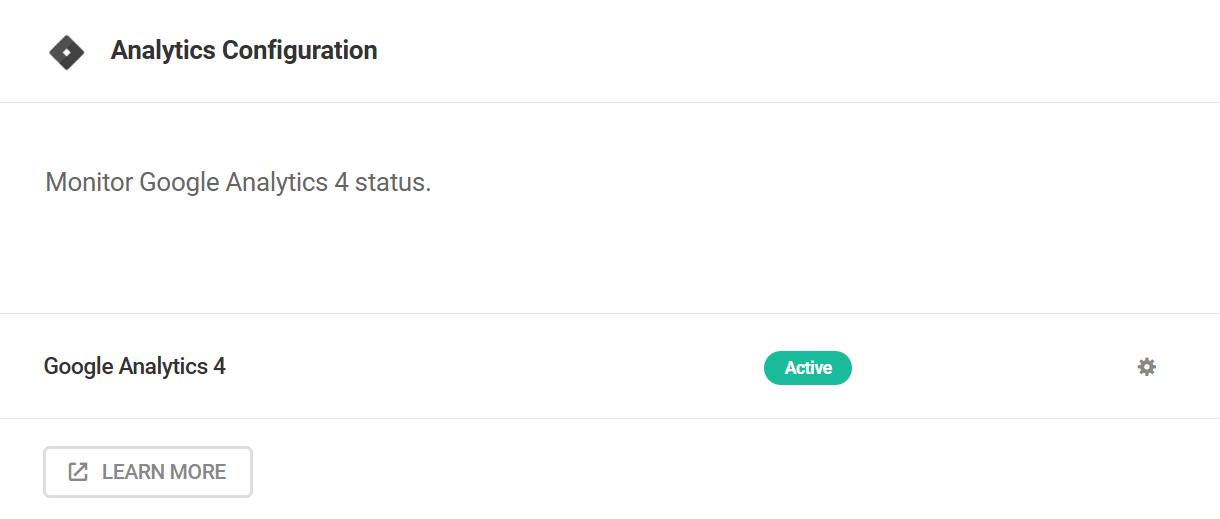
Analytics Configuration
This widget displays the status of your Google Analytics 4 configuration. Click the gear icon to quickly access the settings.
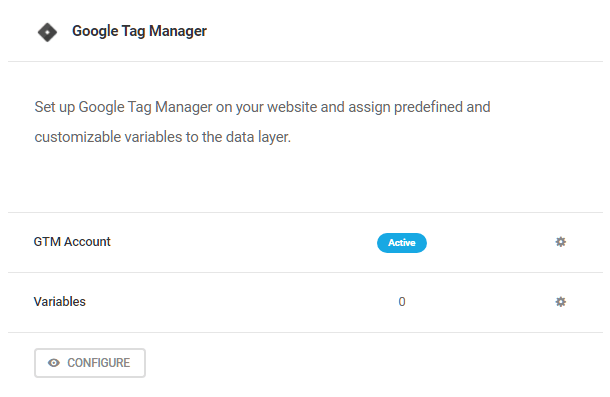
Google Tag Manager
This widget simply displays the current status of the Google Tag Manager integration, and how many variables you may have set up. Click the gear icons for either to quickly access their settings.
10.3 Google Analytics
Copy chapter anchor to clipboardThis is where you’ll manage your Google Analytics account once you’ve authenticated it for use with Beehive, either during the Quick Setup or on the Accounts screen.
10.3.1 Statistics (Analytics)
Link to chapter 3The statistics tab allows you to view all of your stats from one area.
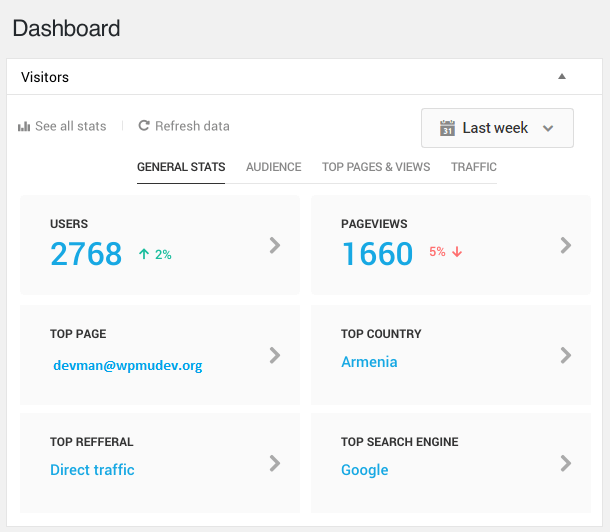
Visitors
The Visitors panel displays traffic and activity data across multiple metrics, and using the available filters, will display comparative data over selected time frames.
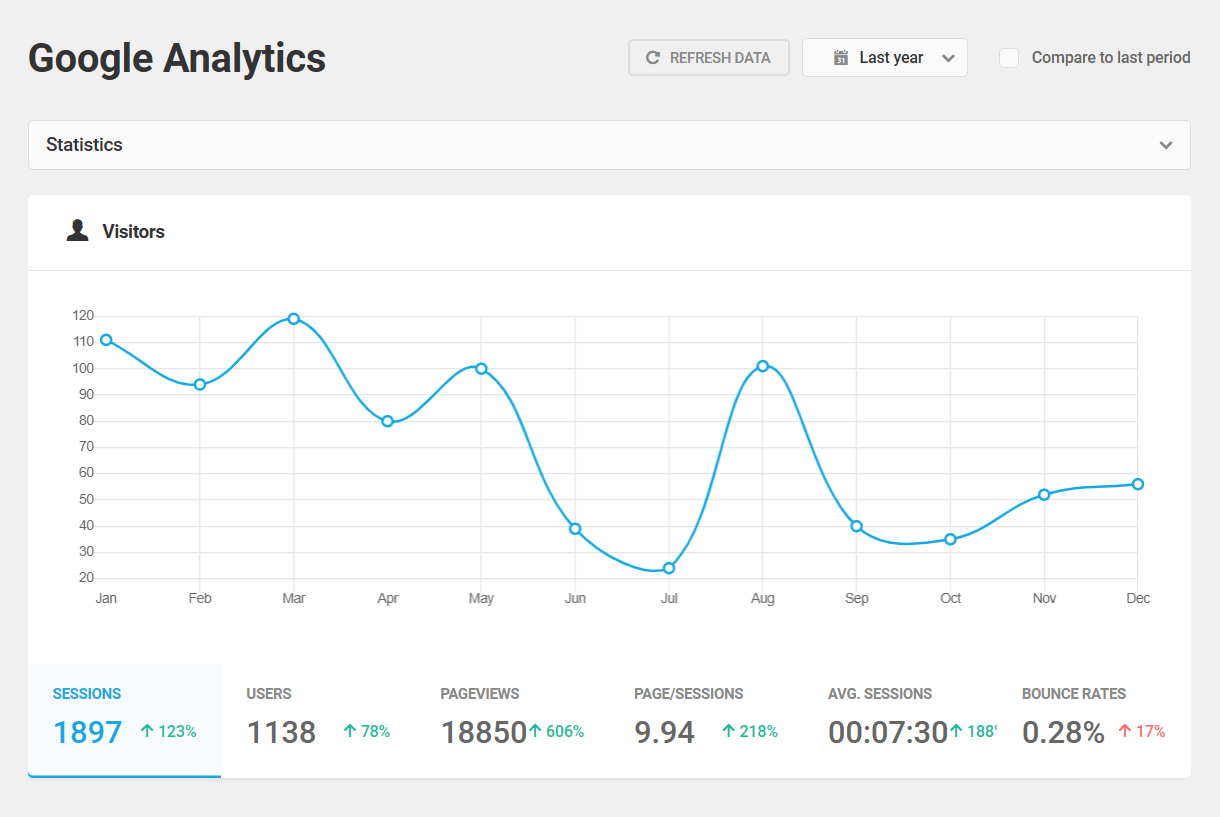
The data for each metric during the currently selected time frame is displayed along the bottom of the panel. Click any metric to view a chart detailing that metric’s activity over time.
These metrics are defined as:
- Sessions – The number of unique user sessions during the selected time frame. A session is defined as a group of user interactions with your website that takes place within a given time frame.
- Users – The number of unique individual users who interacted with a site during the selected time frame.
- Pageviews – The number of pages that were fully loaded into a browser at the request of users. A user who views five pages in one session will result in a single session and five pageviews.
- Pages/Session – The average number of pages users viewed during a single session.
- Average Time – The average amount of time users spent interacting with a site during a single session.
- Bounce rate – A bounce occurs when a user leaves a site shortly after arriving without interacting with any elements on the page. The bounce rate is the number of these events as a percentage of all sessions during the selected time frame.
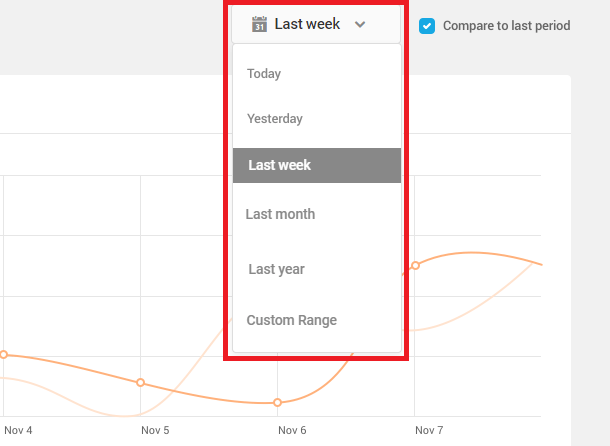
Time Frame Filter
Use the time frame filter to display data for a variety of periods, including custom data ranges.
Changing the time frame will refresh the data for every chart on the Statistics page, so all charts display data for the same period.
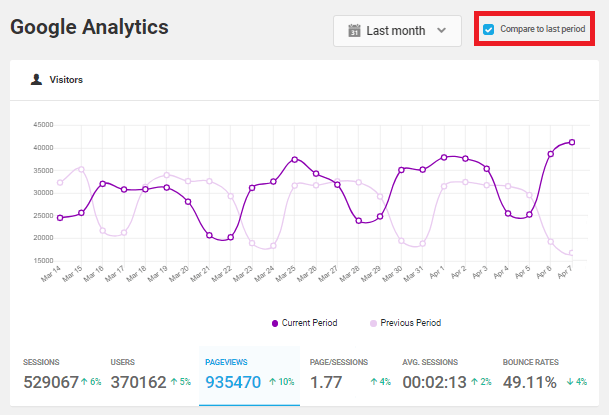
Compare to last period
Select the Compare to last period option, and then click a metric to see a comparison of the current data for that period and the data for the time frame preceding the current time frame.
For example, the lighter-colored line in the image below shows a site’s pageview data for the last month, while the bolder line shows the same metric for the month immediately preceding the last month.
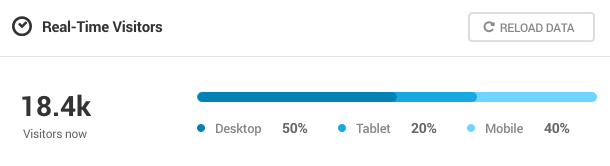
Real-Time Visitors
View the real-time data of your site’s visitors, which is categorized by device. This panel displays the total number of current visitors, as well as a percentage breakdown by the following devices.
- Desktop
- Tablet
- Mobile
Mediums, Search Engines, and Top pages
Beehive displays key Search Engine Optimization data in three circle charts directly below the Visitors data.
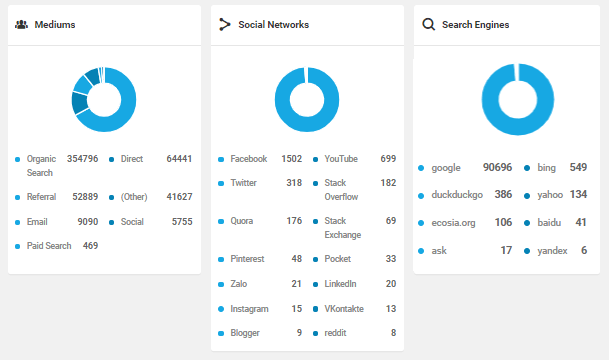
These charts show traffic data in the following categories:
- Medium – The various sources for site traffic: organic, direct, referral, and so on.
- Social Networks – Traffic that was referred to a site from a social network.
- Search Engines – A ranking of search engines based on the amount of traffic derived from those sources.
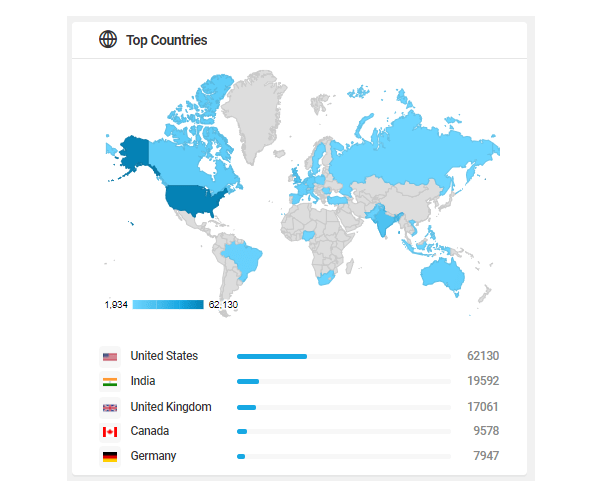
Top Countries
The Top Countries chart uses color coding to show, geographically, where traffic is coming from to a site and the number of visitors from each country during the selected time frame.
Top Pages
A list of a site’s most visited pages and the number of visitors who viewed the pages during the selected time period, as well as the average amount of time users spent on that page and the percent change since the previous period.
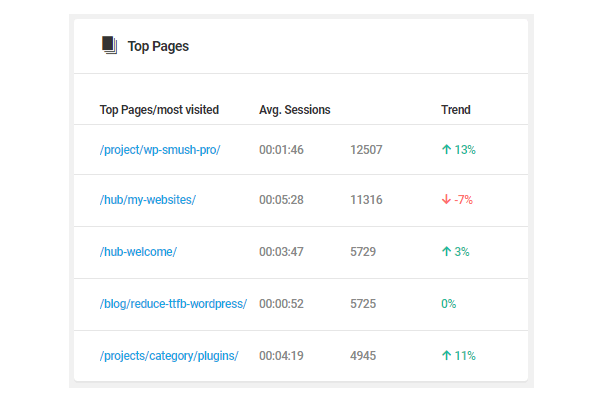
The list contains links to the listed pages. Click any link to view that page.
10.3.2 Account (Analytics)
Link to chapter 3You can create multiple views or data streams for each property (domain/site/network) in Google Analytics. This allows you to create more narrowly tailored reports, which has the added benefit of cleaning up the data as Google separates it from the rest.
Analytics 4 Profile
Once you have authenticated with Google Analytics on the Accounts screen, select the one you wish to connect in the Choose your account dropdown. Then select the property and stream to fetch data from.
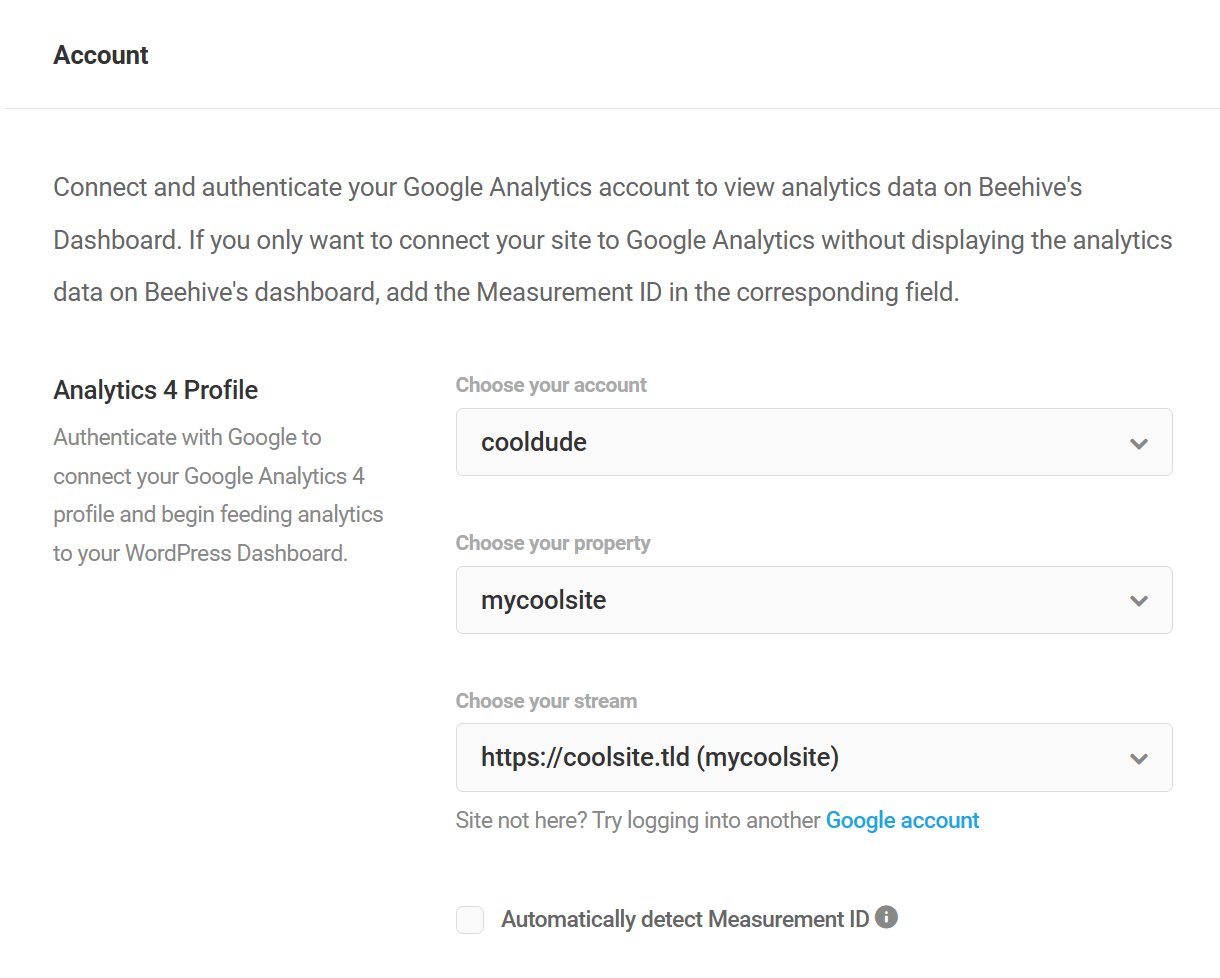
Check the box to Automatically detect Measurement ID so Beehive can add it to all pages of your site.
If you only want to send analytics data to your Google Analytics account without displaying anything in your WordPress dashboard, you can manually enter the Measurement ID without selecting anything above.
10.3.3 Settings (Analytics)
Link to chapter 3Admin pages tracking
By default, only the activity on the frontend pages of your site is tracked. However, by enabling this Admin Page Tracking feature, activity in the wp-admin is also tracked.
![]()
IP Anonymization
Google does collect IP addresses in order to report geolocation data, but those addresses are never reported and are stored in an anonymous state. When enabled, IP Anonymization modifies collected IP addresses so they cannot be used by Google and allows you to ensure your audience that you are not leaving it up to Google to protect their data.
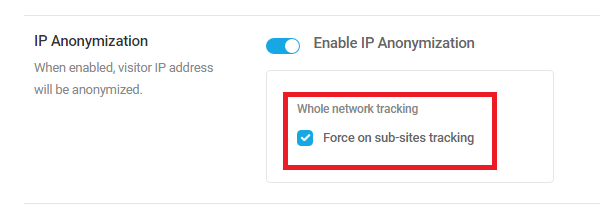
Multisite Super Admins have an additional option that, when selected, forces all subsites to anonymize IP addresses, as well.
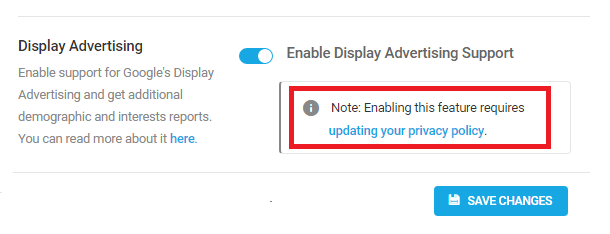
Display Advertising
When enabled, this feature adds Google advertising cookies to your site or network so you can do things like:
- Create Remarketing Audiences based on specific behavior, demographic, and interest data, and share those lists with Google Ads.
- Use demographic and interest data in your Analytics reports.
- Create Segments based on demographic and interest data.
Keep in mind that you may need to update your privacy policy if you wish to enable this feature.
Exclude Roles from Tracking
If you don’t want certain users’ activity to be tracked and added to your analytics, you can exclude them by roles. Search for the user role and select it to ensure that when any users with that role are logged into the site, their activity will not be tracked. You can add multiple roles if you wish.
![]()
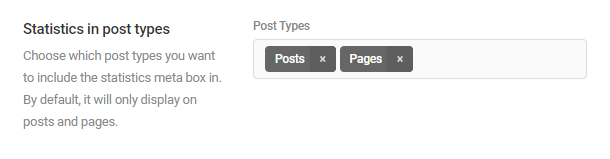
Statistics in post types
This allows you to display the statistics meta box on custom post types. By default, posts and pages are already included but you can remove these by clicking the x icon next to the name. Simply type in the name of the post type and select it from the dropdown.
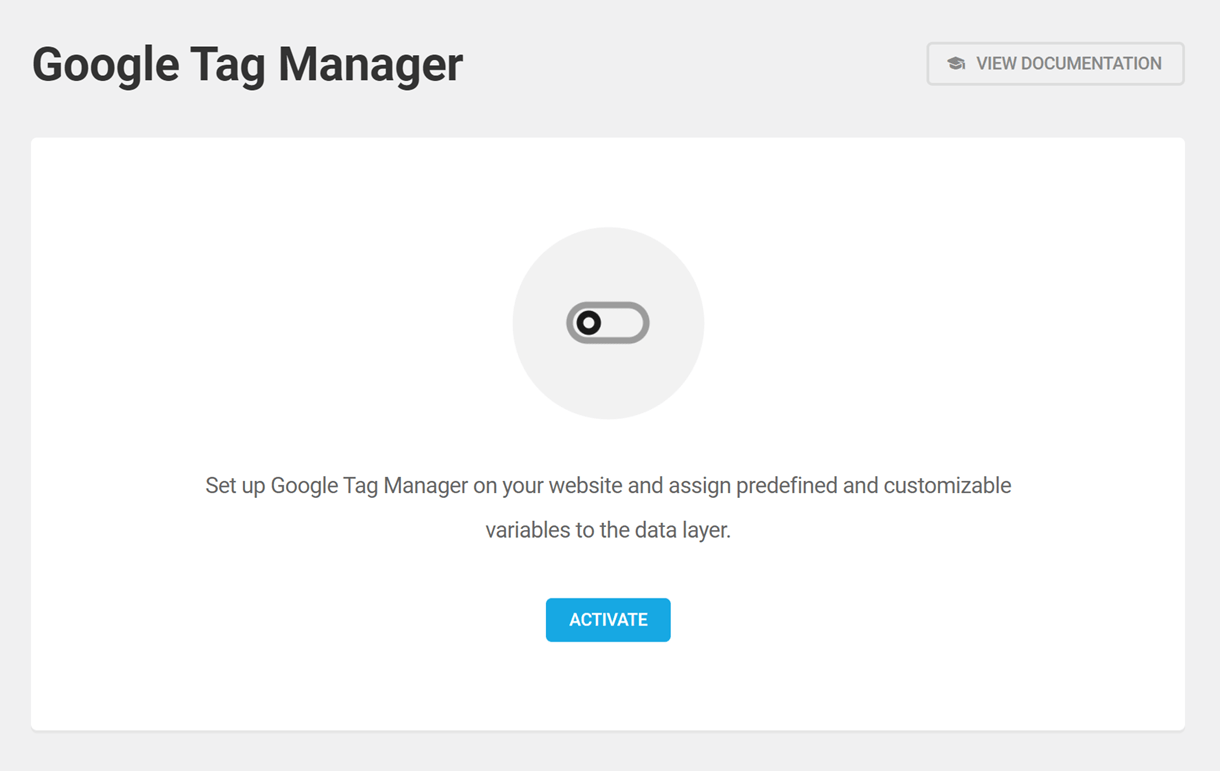
10.4 Google Tag Manager
Copy chapter anchor to clipboardThis section enables you to integrate Google Tag manager with Beehive. To activate the integration, start by clicking the Activate button.
Note that if you have already integrated Google Analytics with your Google Tag Manager account, you do not need to connect Analytics to Beehive; the Tag Manager container you connect will handle that for you.
If you have not connected Analytics to Tag Manager yet and wish to do so, see Google’s guide to help you get that done.
10.4.1 Account (Tag Manager)
Link to chapter 4Add your Google Tag Manager container ID (GTM ID) in the field provided and click Save Changes. If you’re not sure where to find your GTM ID, see this Google help doc.
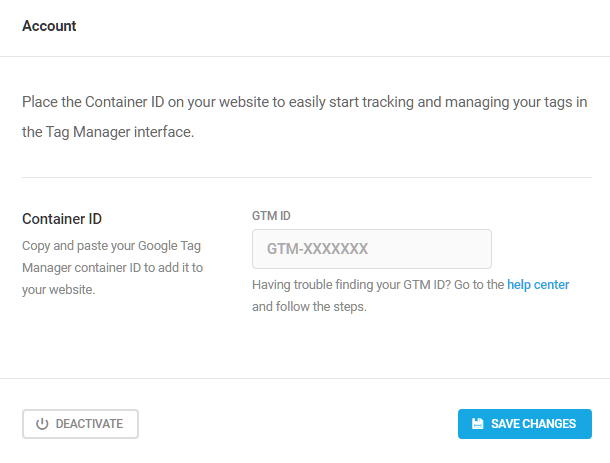
If you are testing things on a staging site, you can create and use different Container IDs for your live and staging sites so your live GTM data doesn’t get “polluted” with staging data.
10.4.2 Settings (Tag Manager)
Link to chapter 4In the Settings section are several built-in variables that you can enable, and you can define your own custom ones as well if needed.
You can use the data in your Google Tag Manager account as you see fit. If you need help with that, see this Google doc: https://support.google.com/tagmanager/answer/6164391
Default
Under the Default tab, you’ll find a number of post-related variables are built-in. Enable the ones you need by clicking the toggle on the left.

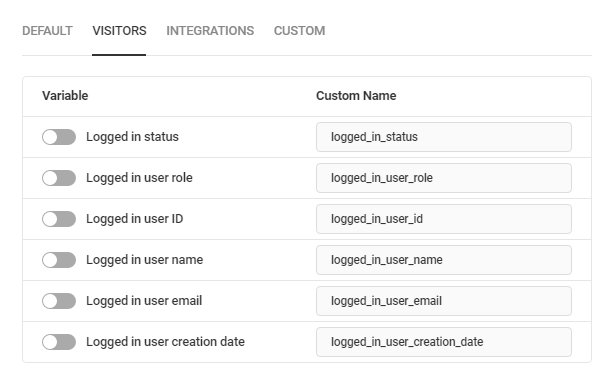
Visitors
Under the Visitors tab, you’ll find several variables related to the current visitor’s status. Enable the ones you need by clicking the toggle on the left.
Integrations
Under the Integrations tab, you’ll find variables related to currently supported plugins or services. At this time, WPMU DEV’s Forminator and Hustle plugins are supported. Note that if any plugin is not active, their options will appear greyed out here.
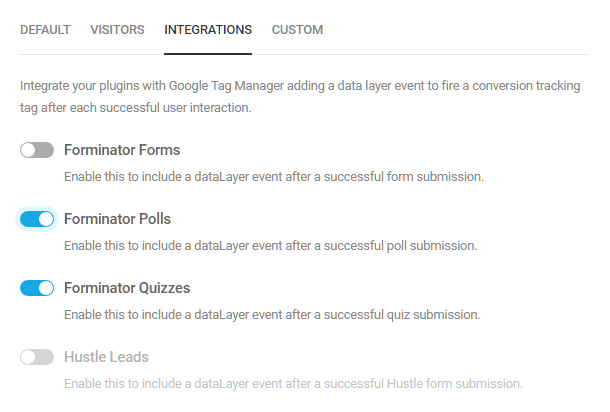
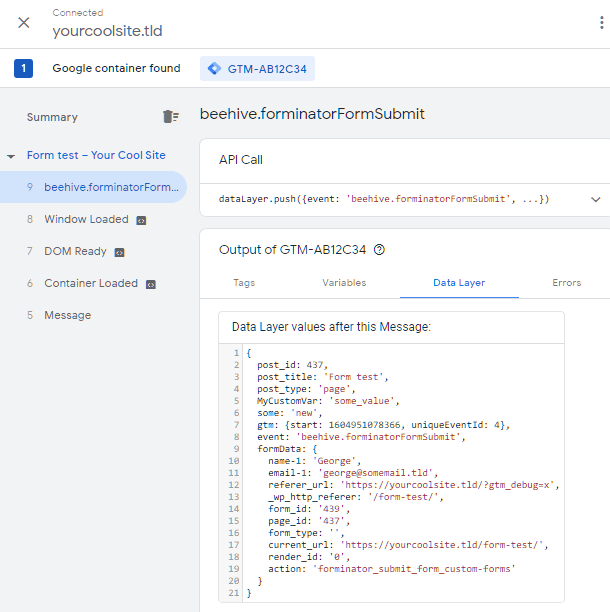
When any of the integration options are enabled for Forminator, and a form/poll/quiz is submitted successfully, Beehive will send a Data Layer event with form/quiz/poll data to GTM. The event names are:
- beehive.forminatorFormSubmit (for Form)
- beehive.forminatorPollSubmit (for Poll)
- beehive.forminatorQuizSubmit (for Quiz)
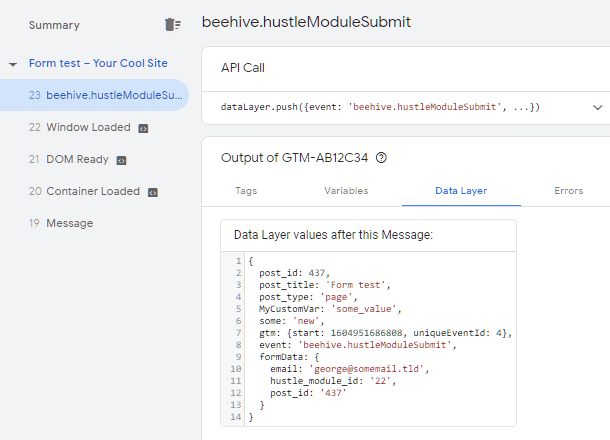
When integration is enabled for Hustle Leads, and an optin module is successfully submitted, Beehive will send a Data Layer event with module data to GTM. The event name is:
- beehive.hustleModuleSubmit (for all modules)
Excluding Forminator Field Data
If you need to exclude certain Forminator field data from the DataLayer sent to your Google Tag Manager, you can use the beehive_gtm_forminator_excluded_fields filter in your active theme’s functions.php file or a mu-plugin.
For example, you could anonymize the data sent to GTM by excluding the Name & Email fields from all forms using the code below. Add any additional field names on new lines as in this example. Note however that it is not possible to specify a form ID, so the specified field data from all forms would be excluded.
This filter can also be used to exclude field data from quizzes or polls. Just remember to specify the field names for these uses as well, not the IDs. For example, the answer field name from a poll could look like answers[question-3410-549], and from a quiz, it could look like 931.
There is unfortunately no equivalent filter for Hustle optin forms. This may be included in a future update however.
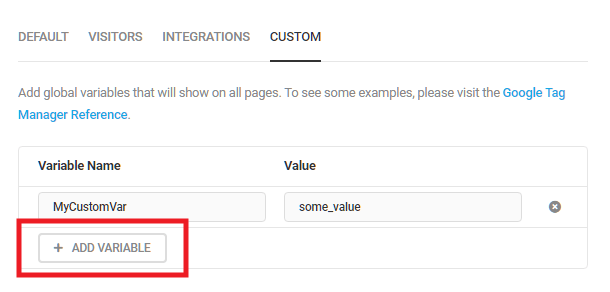
Custom
Under the Custom tab, you can define your own custom variables if needed. To add a variable, click the Add Variable button, then enter the Name and Value, and click Save Changes.
Verifying data sent to GTM
You can see exactly which data is being sent to your connected GTM account by toggling on the Preview feature in your GTM workspace to open the TagAssistant. Then visit any page on your site and check the output under the Data Layer tab on the TagAssistant screen.
If you have enabled integration options with Forminator, submit a Forminator form/quiz/poll from your site, and you’ll see data similar to the below example, where you can also see all the form field variables along with the defaults and any custom ones you may have added.
If you have enabled the integration with Hustle, an optin module submitted from your site would send data similar to the below example, along with the default and custom variables as well.
10.5 Accounts
Copy chapter anchor to clipboardThis is where you manage your authentication to different analytics services. However, currently only Google Analytics is supported.
If you have already integrated Google Analytics with your Google Tag Manager account, you do not need to connect Analytics to Beehive; the Tag Manager container you connect will handle that for you.
Google Account
To display your Google Analytics statistics in your site admin, you will need to connect with one of the two API methods:
- Connect with Google – A shared API with multiple users.
- Set up API project (Recommended) – Creates a custom API connection for a specific site or network of sites.
If you are unfamiliar with Google APIs, we recommend reviewing the To Share or Not to Share section before proceeding.
Regardless of the option selected to connect to Google Analytics, you can reset the connection by clicking the gear icon once connected, then clicking the Logout option. You can then connect to a different account. Or if you connect once again to the same account, the same data will appear as before.

10.5.1 Connect with Google
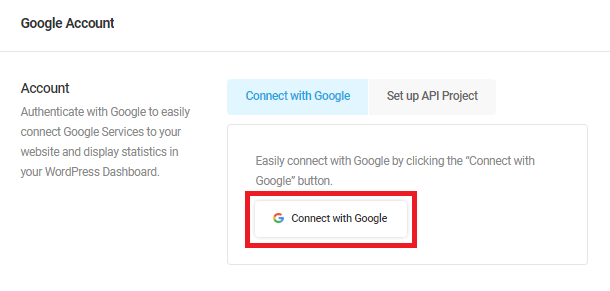
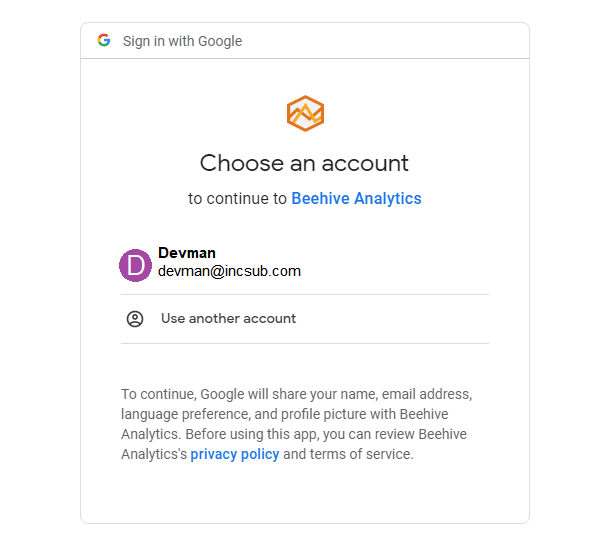
Link to chapter 5If you do not have a custom API project set up, you can use Google’s shared API instead. Click the Connect with Google button to get started. Note that this is the same process if you click the same button in the Quick Setup modal.
Choose the Google account you wish to use to connect Beehive to Google Analytics.
Check the box to allow Beehive to See and download your Google Analytics data.
Then click the Continue button at the bottom.
Beehive is now connected to your Google Analytics account. You can configure the Google Analytics 4 data stream you wish to use for this connection under the Google Analytics > Account tab.
10.5.2 Google API Project
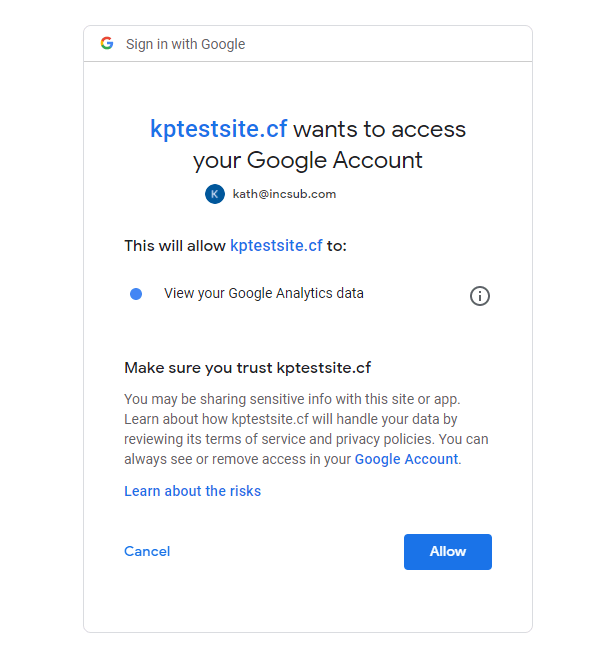
Link to chapter 5To connect Beehive to Google Analytics using a custom API project you created in the Google Developers Console, click Set up API project and enter the Client ID and Client Secret into the fields provided. Then click Authorize.
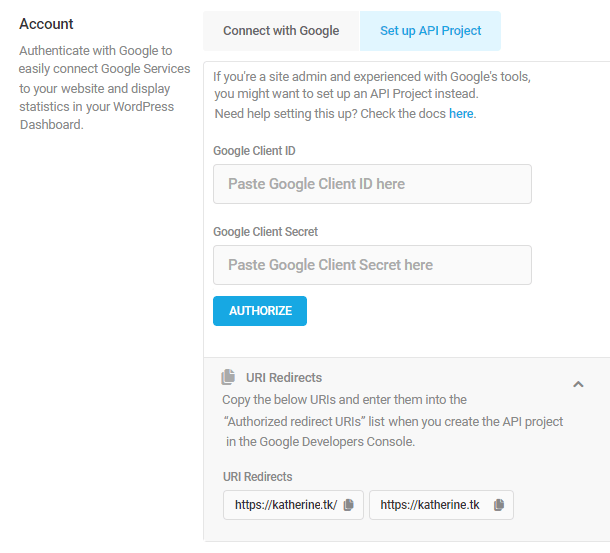
If you have not yet created an API project or don’t have the required credentials, see the detailed instructions in the Set up API project section of this guide.
When you click Authorize, you will be asked to log in to the API project and grant permission for Google Analytics to collect data from this site. Log in with the Google account used to create the project.
Click Allow in the pop up to confirm the connection between Beehive and Google Analytics.
At this point, you have created an API project and given permission for Beehive to pass data to that project. You can configure the view (profile) you wish to use for this connection under the Google Analytics tab.
You can create multiple Views for each property (domain/site/network) in Google Analytics. Multiple Views allow you to create more narrowly tailored reports, which has the added benefit of cleaning up the data as Google separates it from the rest.
10.6 Settings
Copy chapter anchor to clipboardThe Settings area is where site admins can modify Beehive’s configuration to manage plugin data, enable various users and/or user roles to view statistics and adjust plugin settings.
10.6.1 General
Link to chapter 6Manage your general Beehive settings here.
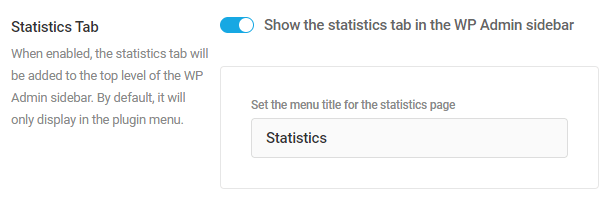
Statistics Tab
If this is enabled, a top-level statistics tab will appear in the WP Admin sidebar which displays your Google Analytics. Click the toggle to enable/disable this feature and replace the name in the available field to rename the tab that will appear in the sidebar.
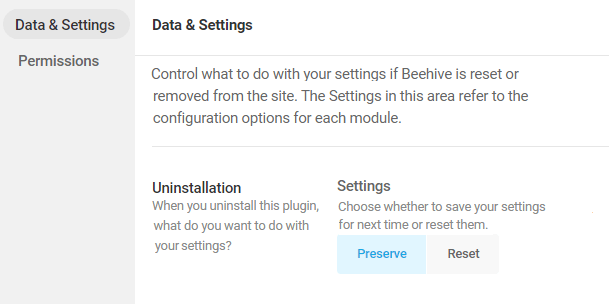
10.6.2 Data & Settings
Link to chapter 6Manage your plugin data settings by configuring the Uninstallation and Reste Settings modules.
Uninstallation
When Beehive is uninstalled, the settings that you have made within the plugin can either be kept by selecting Preserve or be discarded by choosing the Reset option.
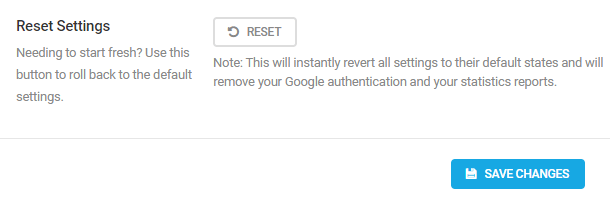
Reset Settings
If you are wanting to start on a clean slate, you can click on the Reset button to instantly revert all the settings back to their default state. Just keep in mind that this will also remove your Google authentication and your statistics report.
10.6.3 Permissions
Link to chapter 6Here you can determine who can see the data and reports compiled by your analytics account.
Statistics
Select either the user roles or the capability required to view your statistics in the WordPress Dashboard area.
User Roles
To adjust this per user role, click on the Roles tab, then toggle on the ones who you want to be able to view the stats.
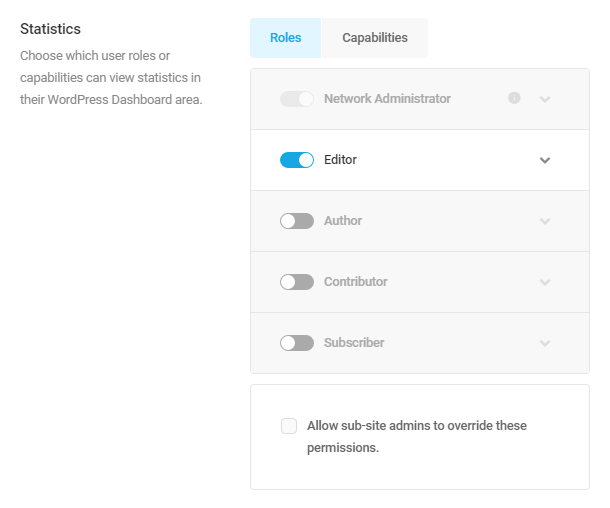
- On single sites, the Administrator role will appear at the top, and is enabled by default.
- On multisite networks, the Network Administrator role will appear at the top, and is enabled by default.
- On multisite networks, the roles enabled will apply to every site in the network unless the Allow site admins to overwrite this setting box is checked.
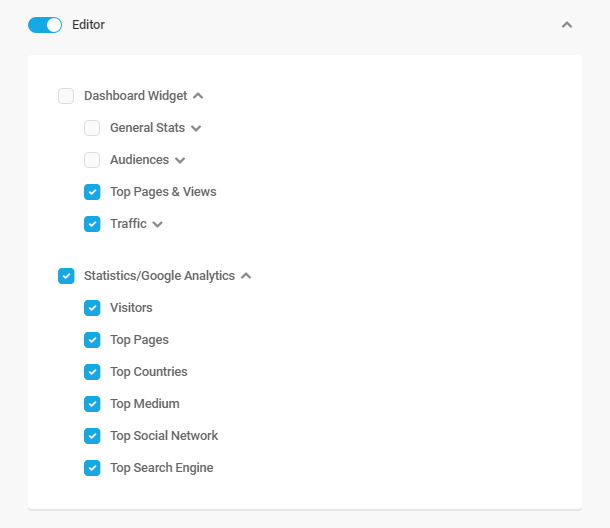
You can fine-tune exactly what you wish selected user roles to be able to view by clicking on the role once toggled, and drilling into the dropdowns to select the specific elements you want.
Capabilities
To adjust this according to a minimum required capability, click on the Capabilities tab. Then enter the capability required to view stats in the admin area. Note there is no fine-tuning available as above for this option.
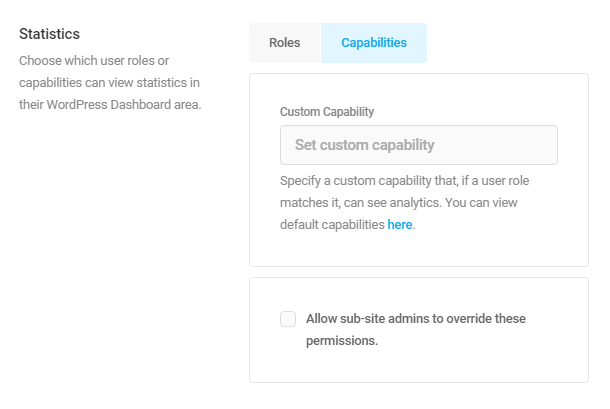
- On multisite networks, the capability set here will apply to every site in the network unless the Allow site admins to overwrite this setting box is checked.
Settings
This section enables you to specify the user roles or users who can access and adjust the plugin settings.
User Roles
To adjust this per role, click the User Role tab, and select the roles you need.
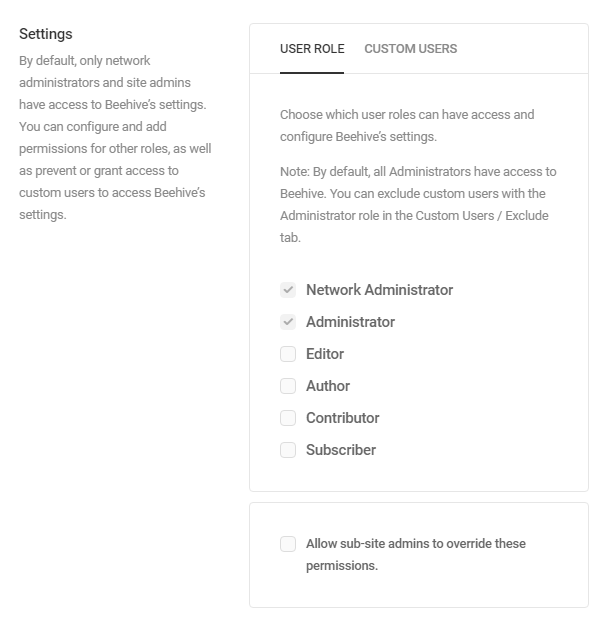
- On single sites, the Administrator role will be enabled by default.
- On multisite networks, the Network Administrator role will also appear there and be enabled by default.
- On multisite networks, the roles enabled here will apply to every site in the network unless the Allow site admins to overwrite this setting box is checked.
Custom Users
To adjust this per user, click the Custom Users tab. Then select either Exclude or Include and click Add User to add the ones you want to exclude or include from the User Role settings.
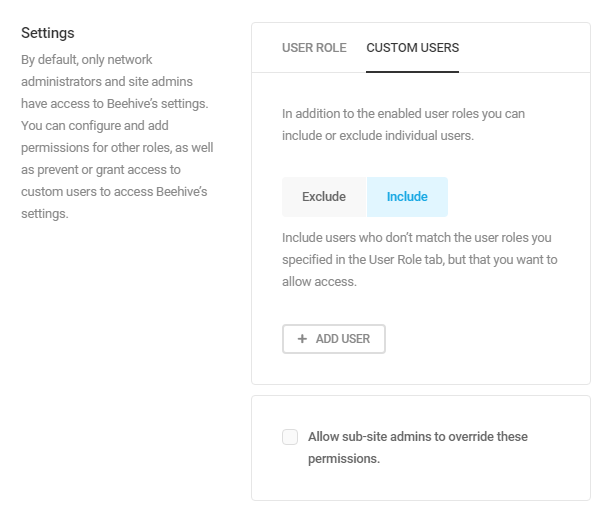
- Here again, on multisite networks, the users included/excluded here will apply to every site in the network unless the Allow site admins to overwrite this setting box is checked.
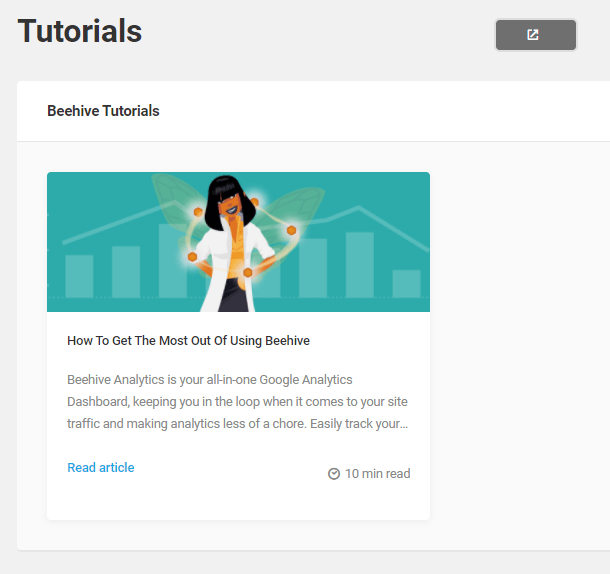
10.7 Tutorials
Copy chapter anchor to clipboardThis is where you can find quick-access links to the tutorial blogs for Beehive. Click on any blog or read more to open the article. You can also click the diagonal arrow icon in the top-right hand corner to open the main Beehive tutorial page.
10.8 Statistics
Copy chapter anchor to clipboardOnce Beehive is connected using one of the two API connection methods, your Google Analytics statistics will be available in two locations:
- Statistics page – A customizable, detailed report of the site or network data over time found in your Google Analytics tab in the plugin. For more information on that statistics page, see the Statistics (Analytics) section of this documentation.
- Statistics widget – Beehive places a widget on the dashboard of each connected site to display a detailed summary of Google Analytics statistics.
Statistics are not displayed on sites or networks that are connected to Google Analytics using a Measurement ID only. If you wish to upgrade your connection to an API, see the To Share or Not to Share section of this guide for more information.
10.8.1 Statistics Widget
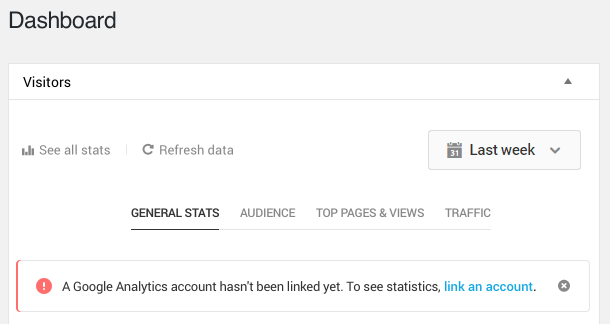
Link to chapter 8The Beehive Statistics widget provides access to site traffic statistics directly from the dashboard of any site with Beehive activated and connected to Google Analytics.
For sites that are not connected to Google Analytics, Beehive will display a notification to that effect. Click the link provided or go to the Accounts module to connect Beehive to Google Analytics.
Widget Tools and Tabs
Use the tools and tabs at the top of the widget to access the desired statistical data or view.
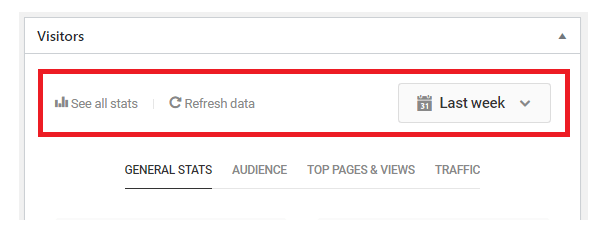
The tools include:
- See all stats – Click to open the Statistics page where a detailed report of site traffic data can be found.
- Refresh data – Click to pull in fresh data from Google Analytics.
- Time frame filter – Click the drop-down menu to apply a custom time frame and display data for the selected period only. The selected time frame will apply to all metrics viewed until the time frame is changed.
The tabs include:
- General stats – Each panel within the General Stats tab can be clicked to see a more detailed display of that data.
- Audience – The Audience tab displays data related to users’ behavior while on a site: numbers of unique users, sessions, page views, and page per session.
- Top Pages and Views – A list of a site’s most visited pages, along with the number of visitors, the average time users spend on those pages, and whether the pages are trending up or down.
- Traffic – This tab displays the leading sources of a site’s traffic geographically, by search engine, medium, and social network.
10.9 Set up API Project
Copy chapter anchor to clipboardThis chapter will guide you through the process of creating a Google API project for Beehive.
Google API projects are created in the Google Cloud Console and involve configuring one or more Google APIs to service websites and other applications. For your analytics needs in Beehive, you’ll be combining several APIs from the Google API library into a single, robust data collection and reporting profile.
Begin by signing into a Google or Google Workspace account you wish to associate with the site on which Beehive is being configured, then navigate to the APIs & Services Dashboard in your Google Cloud Console. If this is your first time accessing the console, agree to the Terms and Service to proceed.
Click Create Project to initiate a new project.
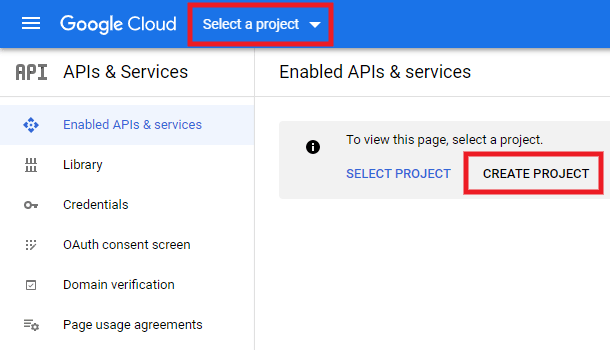
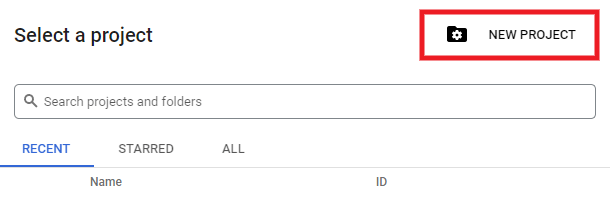
If you don’t see the Create Project link, it may be that an API project was created with this account at some point in the past, possibly unrelated to Beehive.
In this case, click the Select a project drop-down and then click New Project. This is the screen you will come to if you ever wish to modify your Beehive API project or any other Google API projects you may initiate.
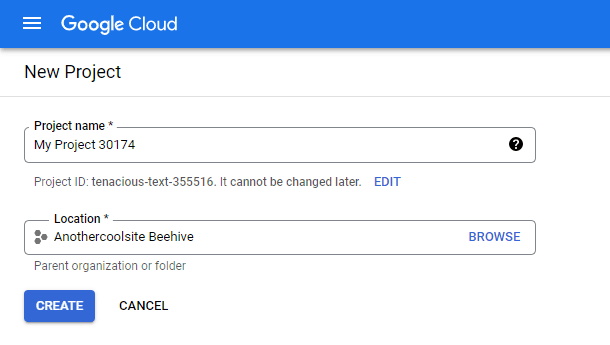
Enter any name you like for the Project name. If you are using a Google Workspace account, select the Organization and/or Location you want to associate with it, then click Create.
10.9.1 Enabling APIs
Link to chapter 9There are 5 APIs that you will need to enable, as follows:
- Google Analytics API – this API enables those with established credentials to configure the data collection and the reporting profile for a specific property.
- Google Analytics Reporting API – this API enables authorized users to build custom dashboards in Google Analytics, automate complex reporting tasks, and integrate with applications like Beehive.
- Google Analytics Data API – this API allows for programmatic access to the report data of the connected account so your Google Analytics 4 data can be displayed in your site admin.
- Google Analytics Admin API – this API allows for programmatic access to the configuration data of the connected account to fetch the list of GA4 properties associated with that account.
- Google People API – this API collects user profile and contact information for consenting users and shares that data with Google Analytics.
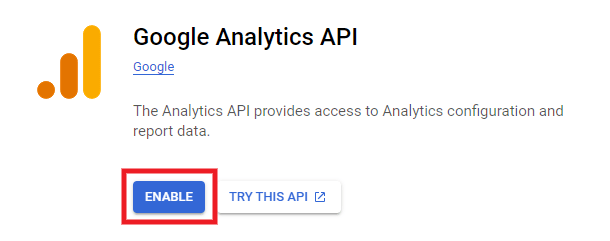
To get started, click the + Enable APIs and Services link to access the Google library of APIs.
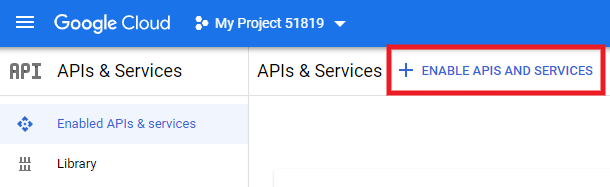
For each of the 5 APIs listed above, use the search tool to locate it.
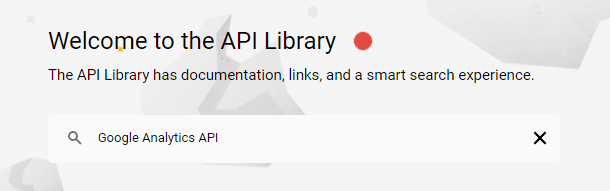
Click on the corresponding result. For example, you would see this when searching for the Google Analytics API:
On the next screen, click the Enable button to enable the API.
If you are prompted to create credentials, ignore the request, and exit the prompt. Google requires OAuth 2.0 credentials for API connections, but it is better to add all the required APIs before creating those credentials.
Once all 5 required APIs are added to the project, it’s time to create the OAuth Client ID.
10.9.2 Credentials and Consent Screen
Link to chapter 9Google requires informed user consent for most of its data collection APIs. In the case of Beehive, Google requires an OAuth 2.0 Client ID which, in turn, requires that users grant consent to the data collection via a consent screen. First, we will configure the consent screen, then the Client ID.
OAuth 2.0 is a protocol intended to ensure users whose data is being collected and handed off to a third-party have consented to that transaction. Google requires sites to identify the data collection app involved and to verify that data is being collected in accordance with Google policies before granting OAuth 2.0 credentials. Depending on the sensitivity of the data or the API involved, Google may require an application and its consent notification to submit to a verification process before providing those credentials. See the Scopes and Verification section of this guide for more information about that verification process.
There are many routes to the OAuth credential screen, but the following path is the most direct.
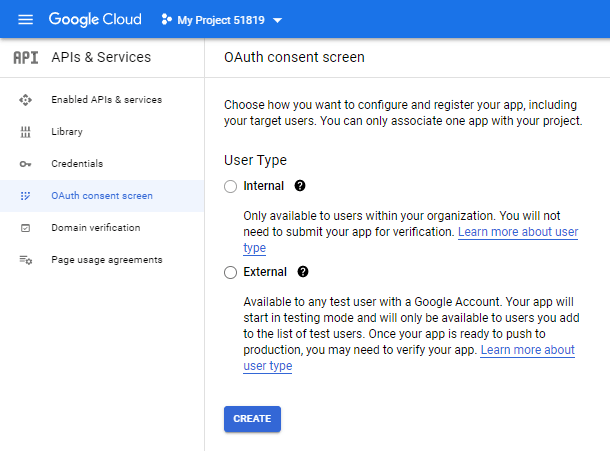
First, navigate to your Google API Project Dashboard by clicking Google APIs in the upper left corner. Once there, click the Oauth Consent Screen tab.
If you’re a Google Workspace user and want this app to be restricted to users within your organization, select the Internal option here. For all other cases, select External. Then click the Create button.
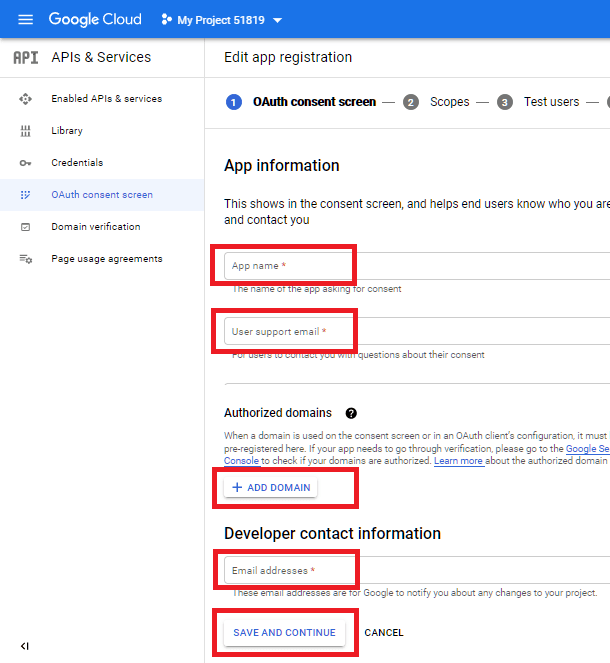
The following screen is where you’ll enter the info that appears on the consent screen when authorizing the app. As you will be the only one authorizing it for integration with Beehive, you should only need to fill in the following required fields:
- App name – enter any name you like
- User support email – use the same address as the Google account you’re logged-in with
- Developer contact email – same as above
Then click +Add Domain and enter your site’s domain name in the Authorized Domains section. Click Save & Continue.
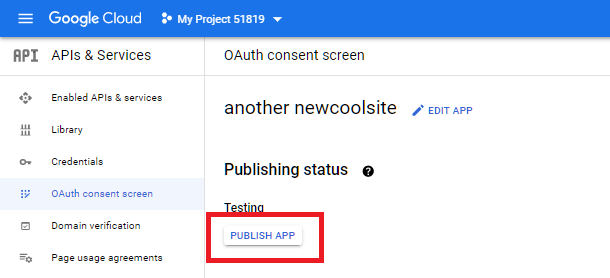
You can ignore everything on the Scopes and Test Users screens, and simply click the Save & Continue button on each of those. Then, on the final Summary screen, click the Back to Dashboard button at the bottom.
On that next screen, click the Publish App button, then the Confirm button in the little modal that pops up.
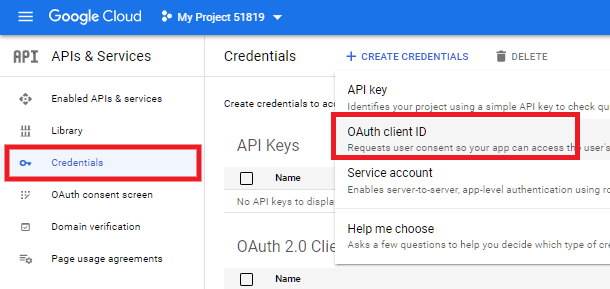
Next, click on the Credentials tab and, in the +Create Credentials dropdown, select Oauth client ID.
Create Client ID
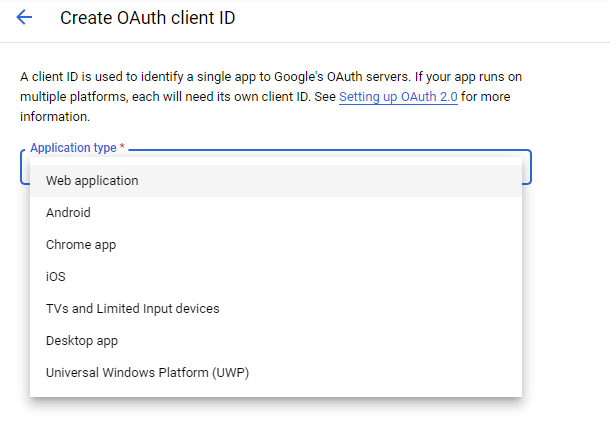
Complete the Create OAuth Client ID form as instructed below and click Create.
Application type – Select Web application and a series of settings relevant to web applications will appear.
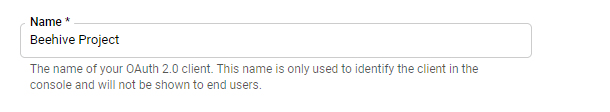
Name – Here you are actually naming the credentials associated with this project. The name can be anything that works for you.
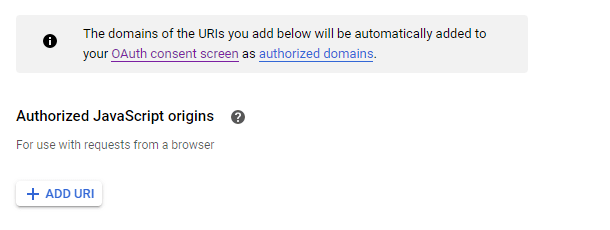
Authorized Javascript origins – All the javascript required for Beehive to function is contained in the app, so Admins can ignore this field.
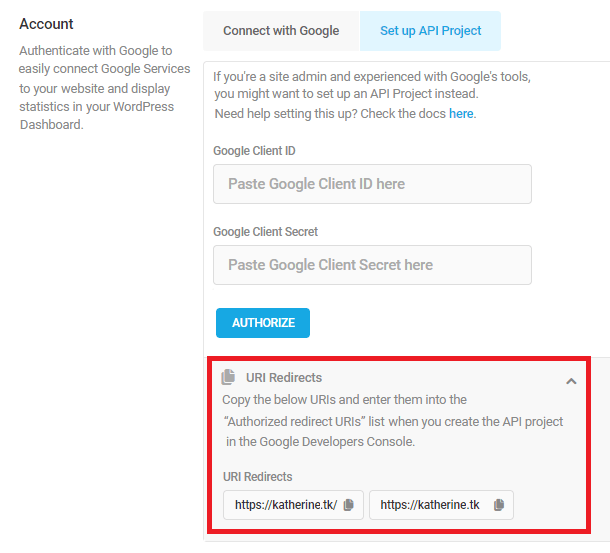
Authorized redirect URIs– You must add the URI of the site being connected twice, once with a slash (/) at the end, and once without a slash (/) at the end.

You can quickly copy your URI redirects by navigating to the Accounts tab in Beehive. Under the Set up API Project section, you will notice a dropdown area for URI Redirects. Click on the row or the arrow to expand the section and you will be able to easily copy both of the URIs required for this step in the process.
When you are ready, click Create and Google will generate your credentials.
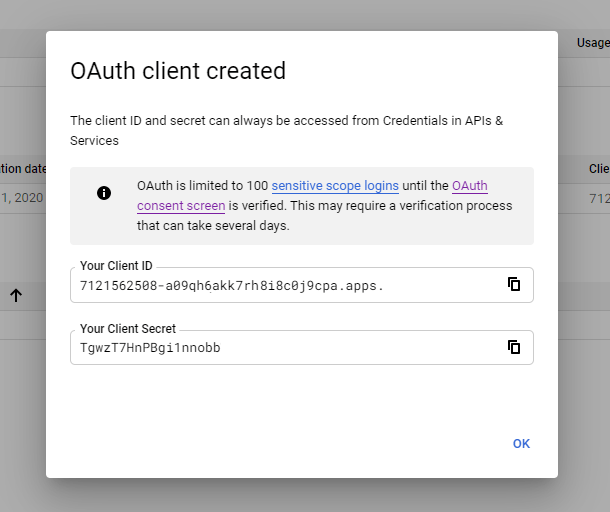
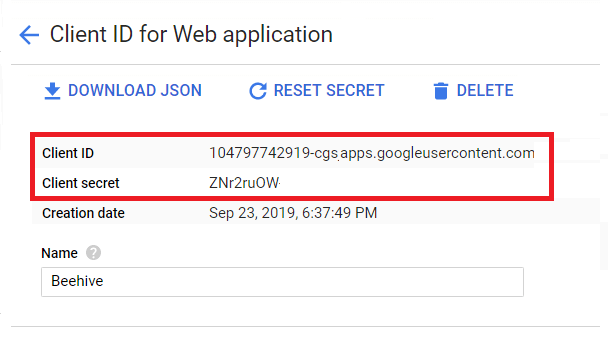
You can copy your Client ID and Client Secret key directly from this module or you can locate them at a later stage in your Credentials tab, as discussed below.
Locating Your Client Secret and Client ID
The Credentials screen contains a list of the Client IDs for all your Google API projects. Each Client ID will have an associated Client Secret, which can be viewed by clicking the name of the project or the pencil icon.
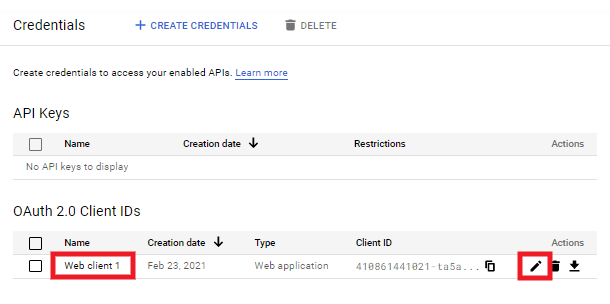
When you open the Client ID page, the Secret Key may not appear immediately. If not, simply refresh the page, and the key should appear beneath the Client ID.
The Client ID for this project cannot be changed, but users can reset the Client Secret as necessary by clicking Reset Secret.
10.11 Connecting a Multisite Network
Copy chapter anchor to clipboardEach subsite in a multisite network must be connected individually. However, if Beehive is installed, network activated, and connected in Network Admin using an API Project, we will use that custom connection for the entire network. This allows subsites to connect with the fast and easy Connect with Google method but still reap the benefits of a custom API connection.
If you are unsure why we recommend creating a custom connection, see To Share or Not to Share.
The steps for connecting Beehive to Google Analytics for a multisite network are essentially the same as connecting a single site, although multisites have a couple of unique options after the connection is complete. Take a moment to familiarize yourself with them now, or return to this section when you are ready to configure these options.
When you’re ready, go to Quick Setup to begin configuring Beehive, and remember to configure the plugin from Network Admin before connecting any subsites.
Granting Permission Authority
After connecting Beehive to Google Analytics in your Network Admin, you can visit Beehive > Settings in your network admin and enable options to allow subsite admins to override your network settings and configure things on their own subsites.
You can allow them to override your permissions for either statistics or access to settings, or both. See the Permissions chapter above for information on that.
10.11.1 Connecting Network Subsites
Link to chapter 11If you followed our advice and connected the network using the Google Analytics API and did so from Network Admin, every subsite can now connect using the simple Connect with Google method.
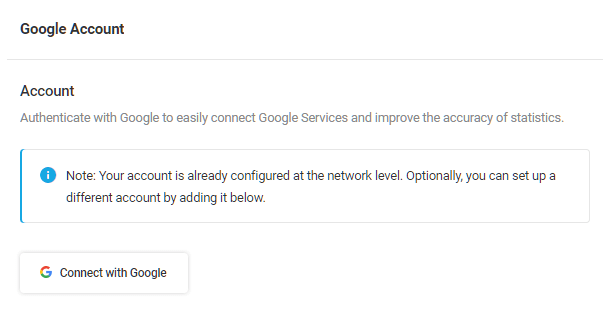
When you visit Beehive > Accounts in any subsite admin, you’ll see a notification that Beehive is connected at the network level, but the subsite admin can connect to their own account should they wish to by using the simple Connect with Google method.
Click Connect with Google, then follow the directions in the Connect with Google chapter above.
10.11.2 Multisite Connection FAQ
Link to chapter 11How will statistics work if Google Analytics is connected only in the network admin?
The Google Analytics 4 tag (G-XXXXXXX) of the data stream (profile) selected in the network admin will be output on all pages of all sites, whether they are domain-mapped or not. Data will be sent to the connected Google Analytics data stream from the entire network.
Statistics for the network will be viewable in the network admin only.
How will statistics work if Google Analytics is connected both in the network admin and in a subsite?
The Google Analytics 4 tag (G-XXXXXXX) of the data stream (profile) selected in the network admin will be output on all pages of all sites, whether they are domain-mapped or not. Data will be sent to the connected Google Analytics data stream from the entire network. Network statistics will be viewable in the network admin.
If a subsite is also connected using the Connect with Google option, the Google Analytics 4 tag of the data stream (profile) selected in that subsite will also be output on all pages of that subsite, whether it is domain-mapped or not. Data will be sent to the connected Google Analytics data stream from that subsite as well. Only statistics for the GA4 data stream selected in that subsite will be viewable in that subsite admin.
How will statistics work if Google Analytics is connected only in a subsite?
The Google Analytics 4 tag (G-XXXXXXX) of the data stream (profile) selected in the subsite will be output on all pages of that subsite only, whether it is domain-mapped or not. Data will be sent to the connected Google Analytics data stream from that subsite. Statistics for that subsite will be viewable in that subsite admin only.
Note that if Beehive is not connected in the network admin, the Connect with Google option is not available on subsites. Connecting only one or more subsites can only be done by using a custom API project for each subsite.
How will Google Tag Manager work if it’s configured only in the network admin?
The Google Tag Manager container ID (GTM-XXXXXXX) entered in the network admin will be output on all pages of all sites, whether they are domain-mapped or not. Data for the variables selected in the network admin > Google Tag Manager > Settings will be included in the data layer sent to the selected GTM container ID from the entire network.
How will Google Tag Manager work if it’s configured in both the network admin and in a subsite?
The Google Tag Manager container ID (GTM-XXXXXXX) entered in the network admin will be output on all pages of all sites, whether they are domain-mapped or not. Data for the variables selected in the network admin > Google Tag Manager > Settings will be included in the data layer sent to the specified GTM container ID from the entire network.
If a different Google Tag Manager container ID is entered in a subsite, that GTM ID will also be output on all pages of that subsite, whether it is domain-mapped or not. Data for the variables selected in the subsite > Google Tag Manager > Settings will be included in the data layer sent to the specified GTM container ID from that subsite.
How will Google Tag Manager work if it’s configured only in a subsite?
If a Google Tag Manager container ID is entered in a subsite only, that GTM ID will be output on all pages of that subsite only, whether it is domain-mapped or not. Data for the variables selected in that subsite > Google Tag Manager > Settings will be included in the data layer sent to the specified GTM container ID from that subsite.
10.12 Get Google Analytics
Copy chapter anchor to clipboardThis chapter will guide you in setting up a Property and a Data Stream in Google Analytics 4, which is now the default API for all new properties.
Note that the following instructions can also be found – without screenshots – in Google’s official help doc here: Add an account, property, or data stream
If you don’t yet have an Analytics account and are perhaps not sure how things work there, here’s the short version: Google Analytics, using javascript, tracks what users do on your site – what links they click, what pages they view and for how long, and many other data points as well.
Google can do this because users – that’s you – insert custom code into the code for every page they want to be tracked (Beehive makes that part easy). This code tells Google who owns the data collected from a given page – you – so it can be associated with the right account in Analytics. The data is then categorized based on a myriad of variables – many of which can be customized in Beehive – and displayed as reports on site dashboards that admins can use to plan and achieve site or network goals.
It may be helpful to also understand how a Google Analytics account is structured. There’s the Account, of course, and within each account there are Properties and within each property, there are Data Streams.
Here’s how Google defines each:
Account: Think of it as the top-level folder that you access using your login details. If you are managing a single website, then one account is sufficient. If you’re managing multiple websites that aren’t directly related, then these should be stored in separate accounts. Google allows users to create up to 100 Analytics accounts within the same Google account.
Property: A “property” is simply Google-speak for a website or network of sites that have been added to a Google Analytics account. When Beehive connects, it connects to a specific property. Each Analytics account can have up to 100 properties.
Data Stream: Data Streams tell Google Analytics what reports should be created for a given property. In simplest terms, each stream is a separate report and can, among other things, display data in realtime on the Realtime screen in your Analytics account. Users can create up to 50 Data Streams per property, each targeting a unique traffic factor or group of factors, as defined by you.
Sign Up
If you already have a Google Analytics account set up and want to use that one, you can skip down to the Creating a new Property section below.
If you don’t already have a Google Analytics account set up, go to the Google Analytics Setup page, and Sign In with the Google account you want to use to connect Beehive on your site.
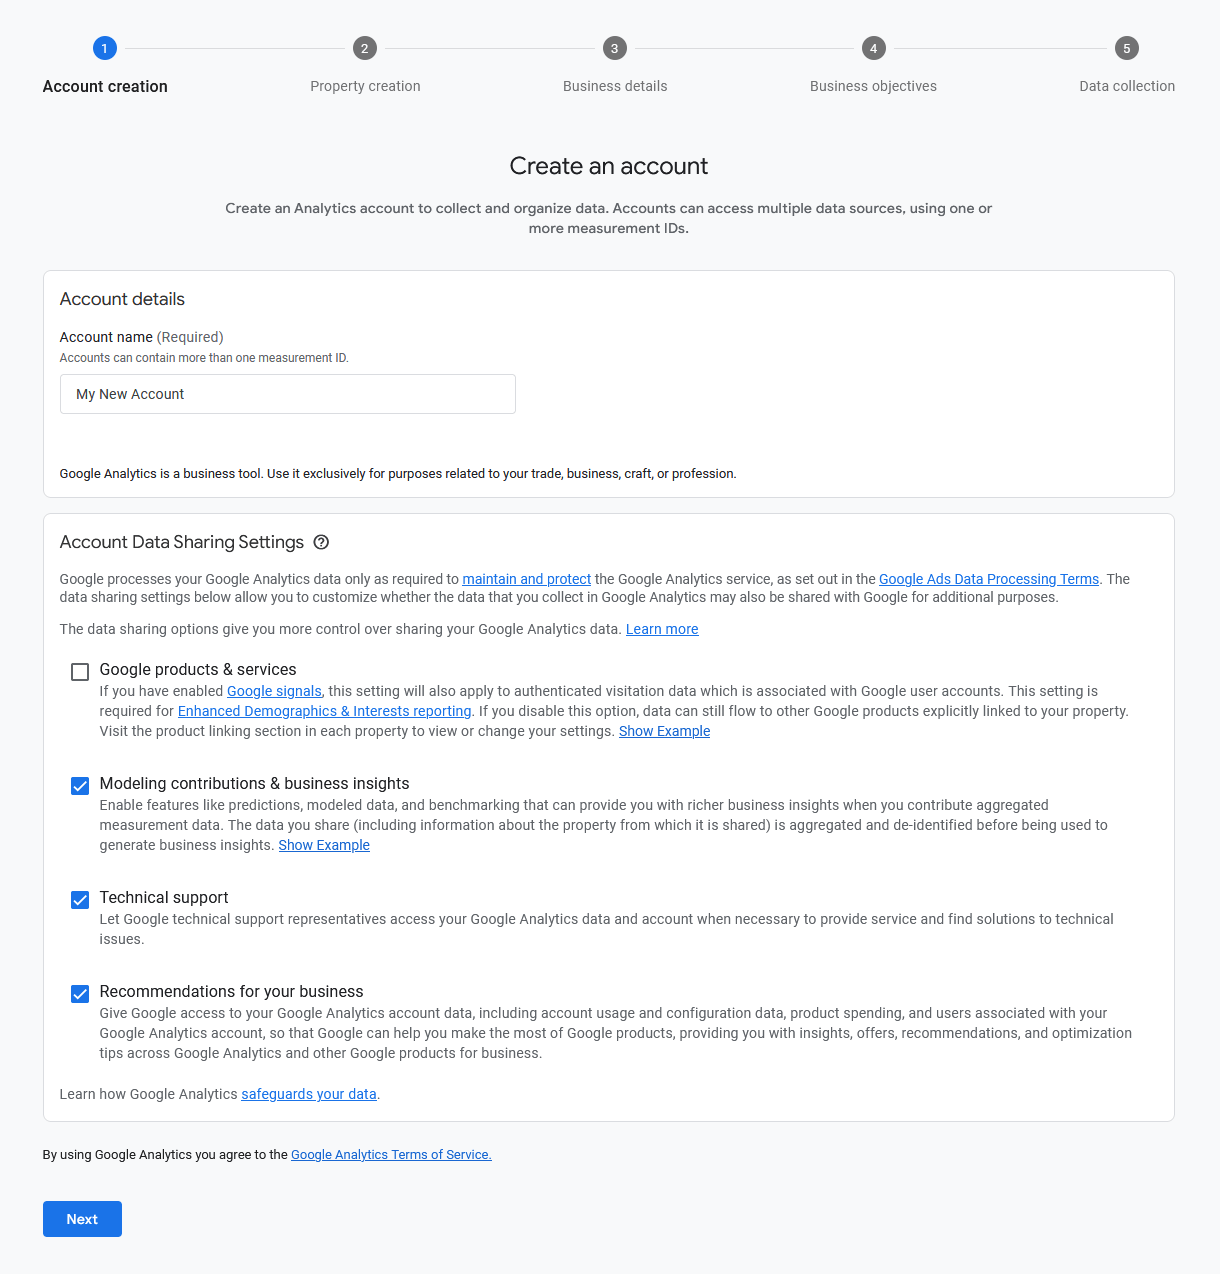
Create Account & Property
Create your Analytics account by simply giving the account a Name and then choosing what, if any, of your collected Data you want to share. Click Next to proceed.
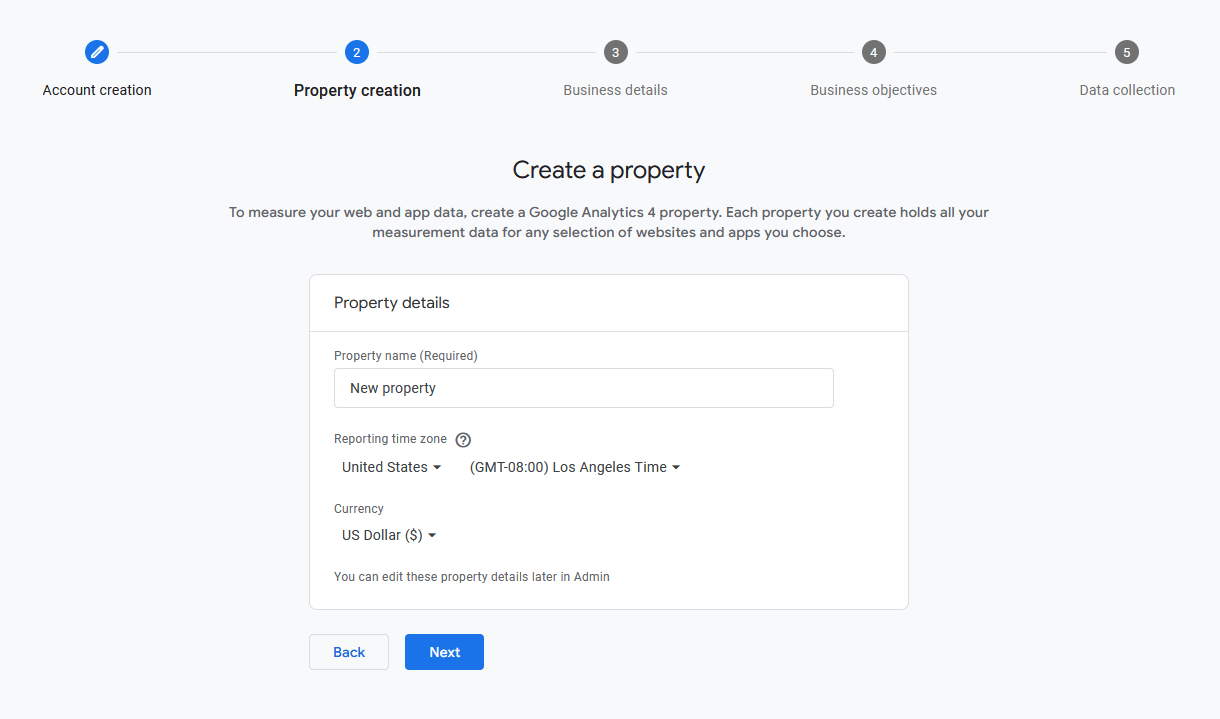
In the next step, give your Property a Name, and select your desired reporting Time Zone and Currency. Click Next to proceed.
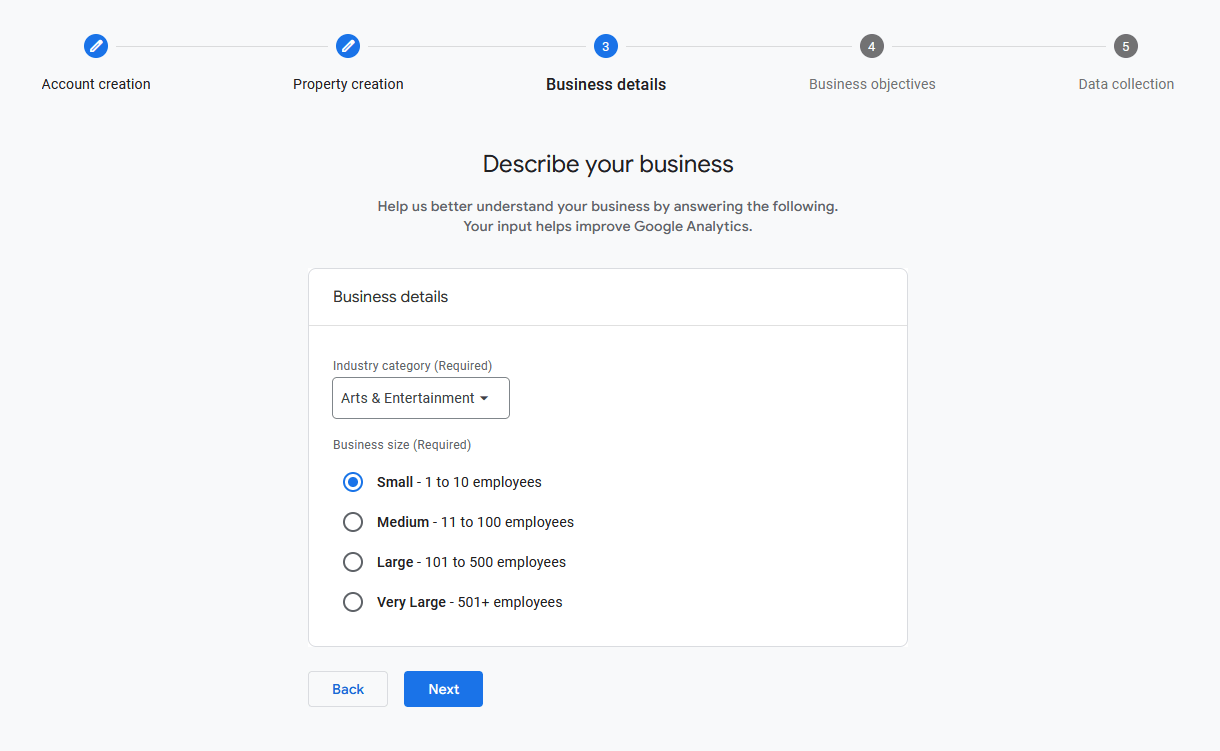
Complete the Business Details and Business Objectives sections and click Create.
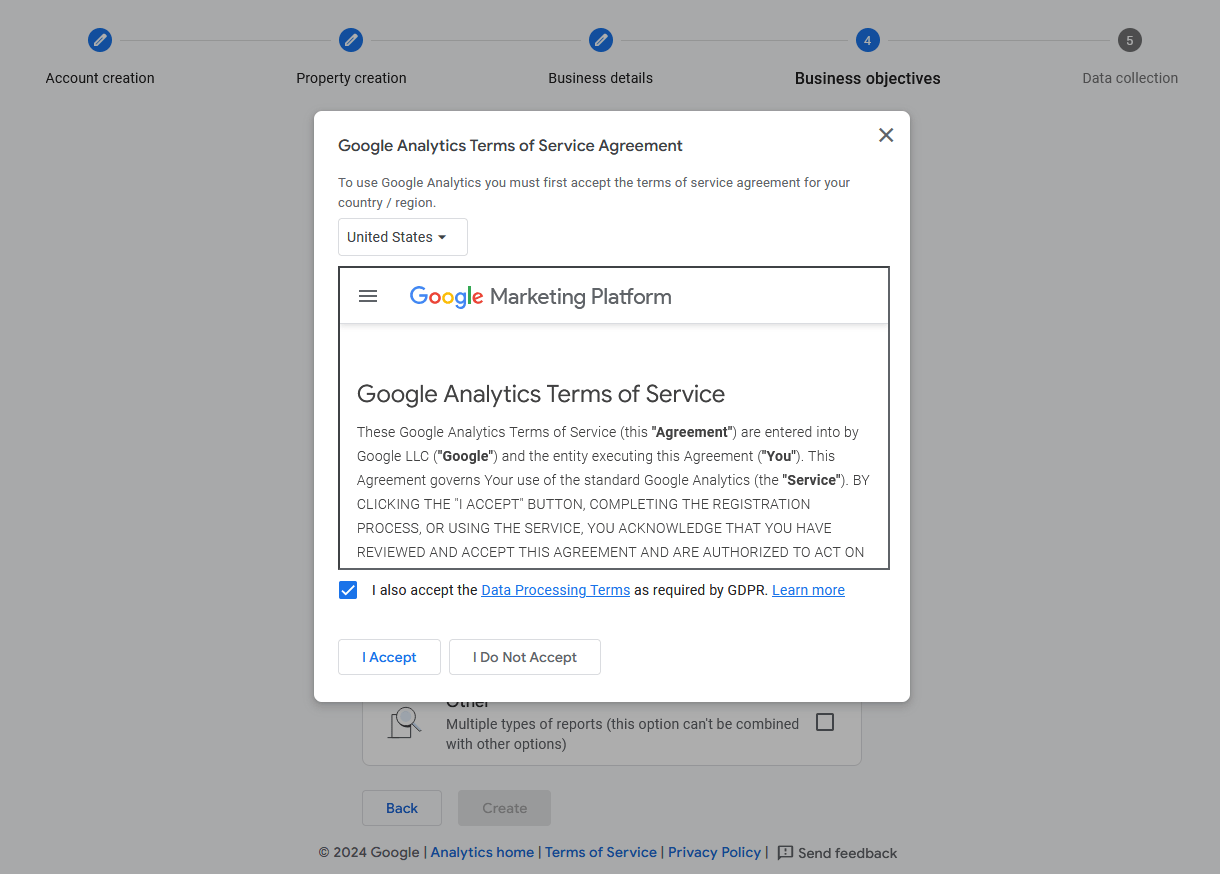
Then check the box to accept Google’s Terms, and click I Accept.
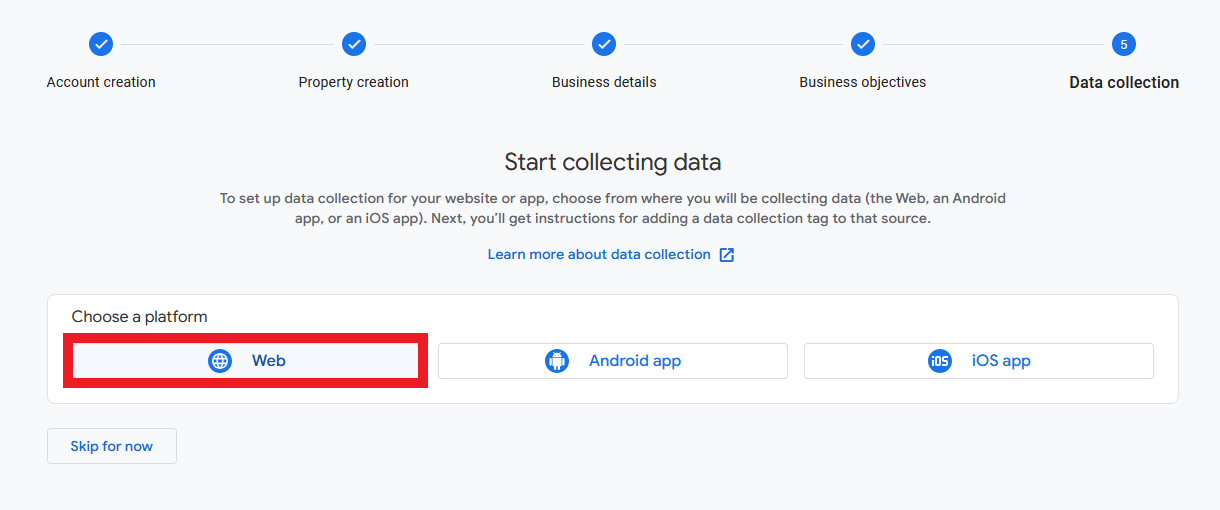
On the last screen of the account setup, you can create your first data stream by selecting the Web option, or click Skip for now to set it up later. If you want to set it up now, follow the directions in Create a Data Stream below as the process is the same.
Creating a new Property
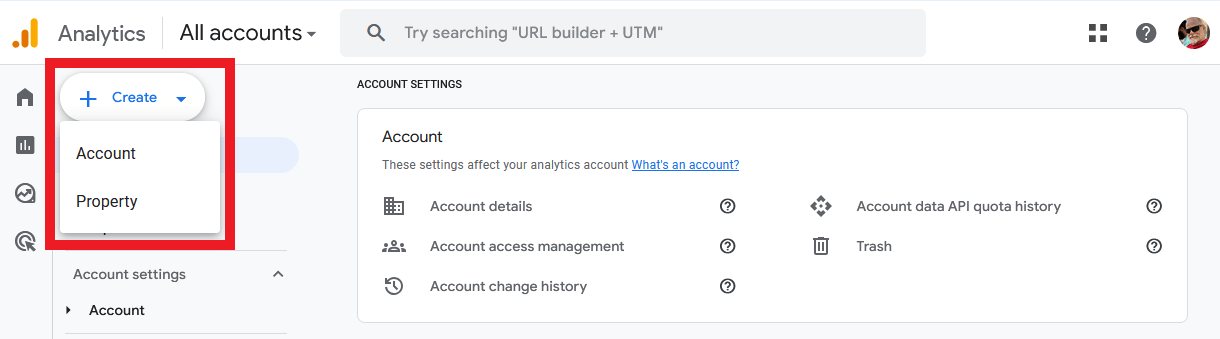
If you already have a Google Analytics account set up, or want to create a new property at any time after your account has been created, click the Admin button located in the bottom left corner of any Google Analytics screen.
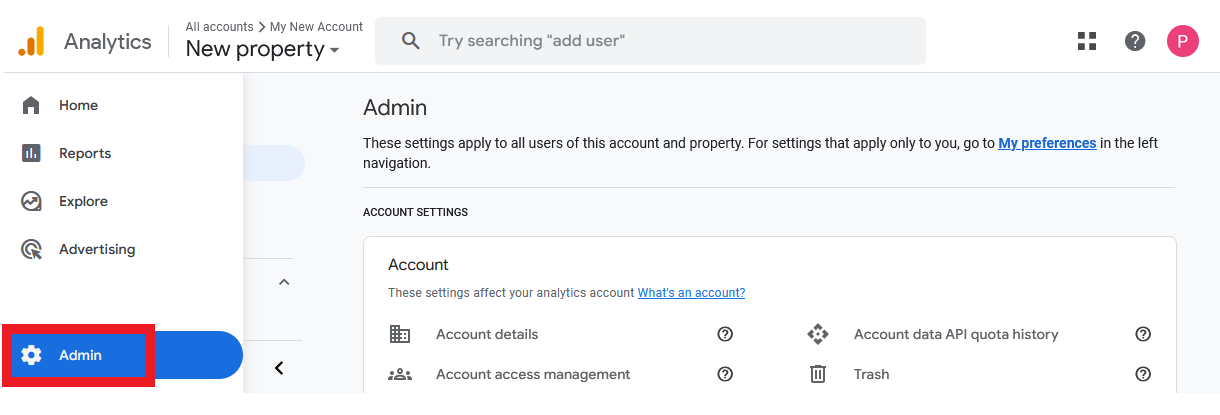
If you have multiple accounts, ensure you’re in the correct one by selecting it from the dropdown at the top-left of the screen. Then click the Create button, select the Property option, and follow the same steps as above when you created the account.
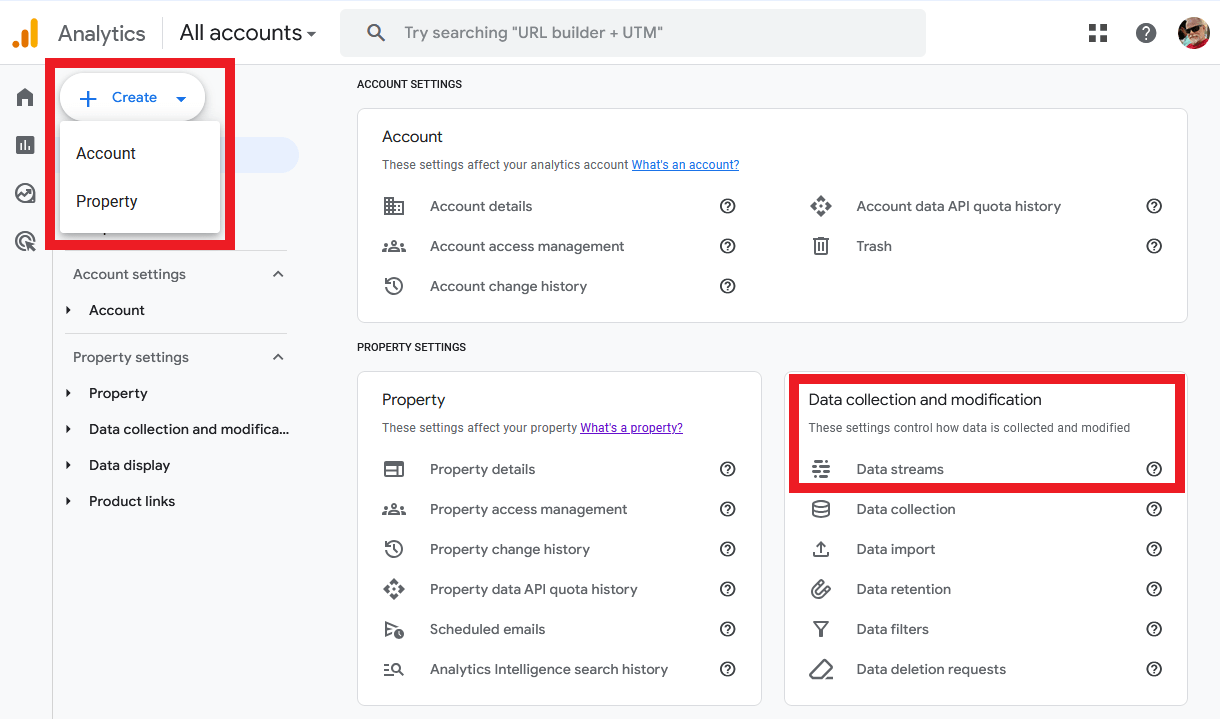
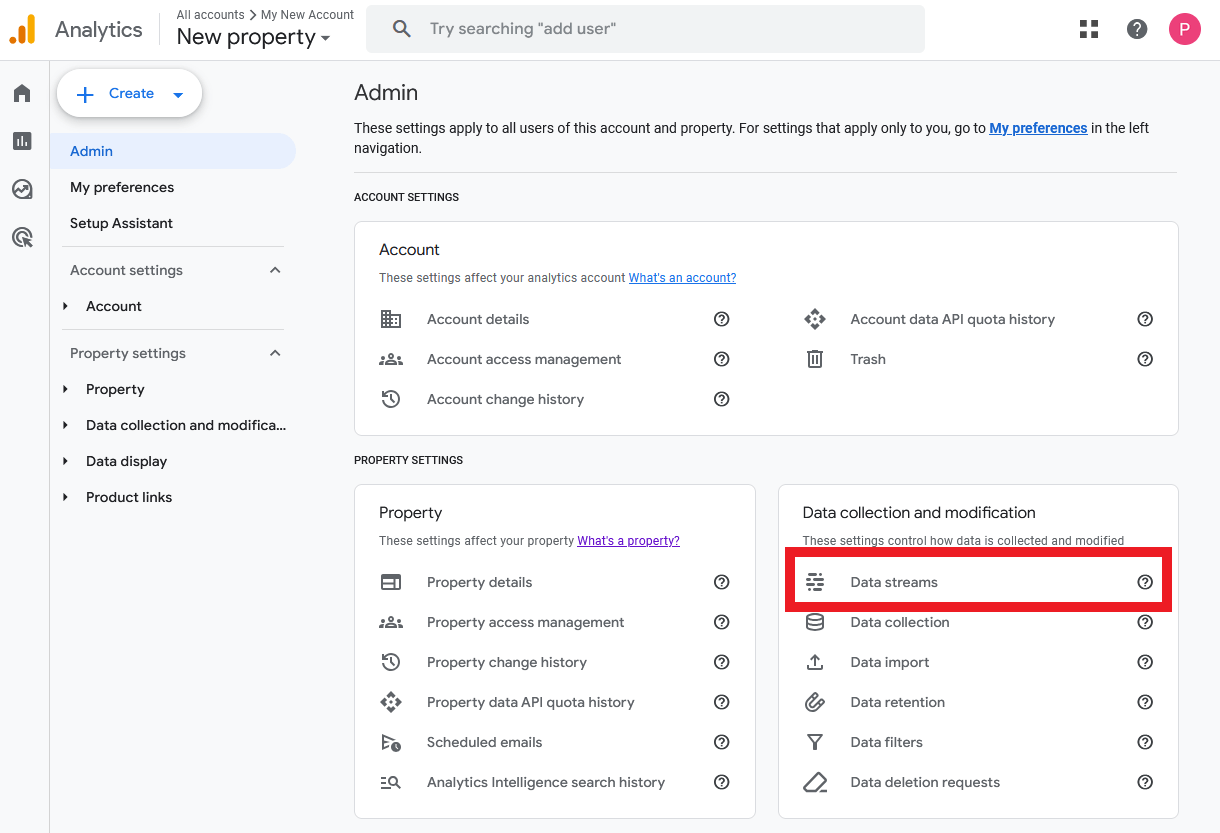
Create a Data Stream
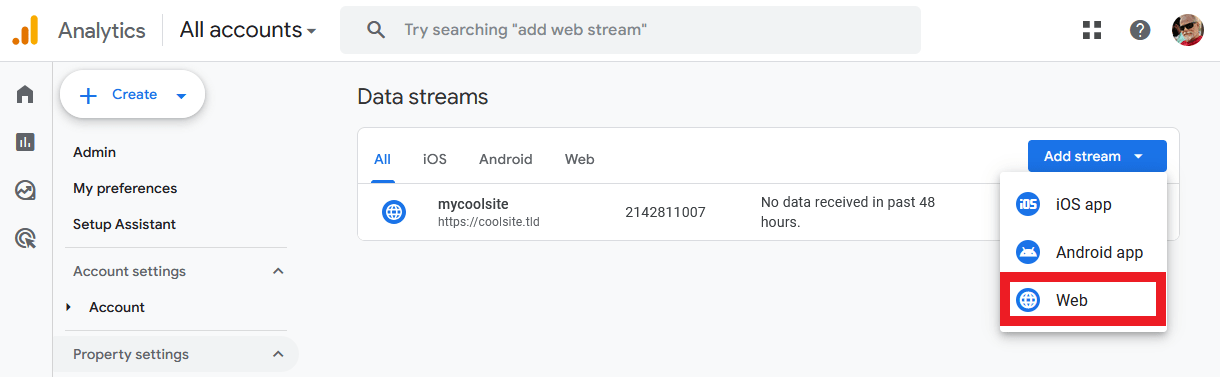
To create a Data Stream for your Analytics account, click on the Admin link in the bottom-left corner and be sure you’re viewing the Property you want. Then in the Data collection and modification section, click on Data Streams.
On the next screen, select the Web option, which would look like this if this is the first Data Stream you’re creating for this account:
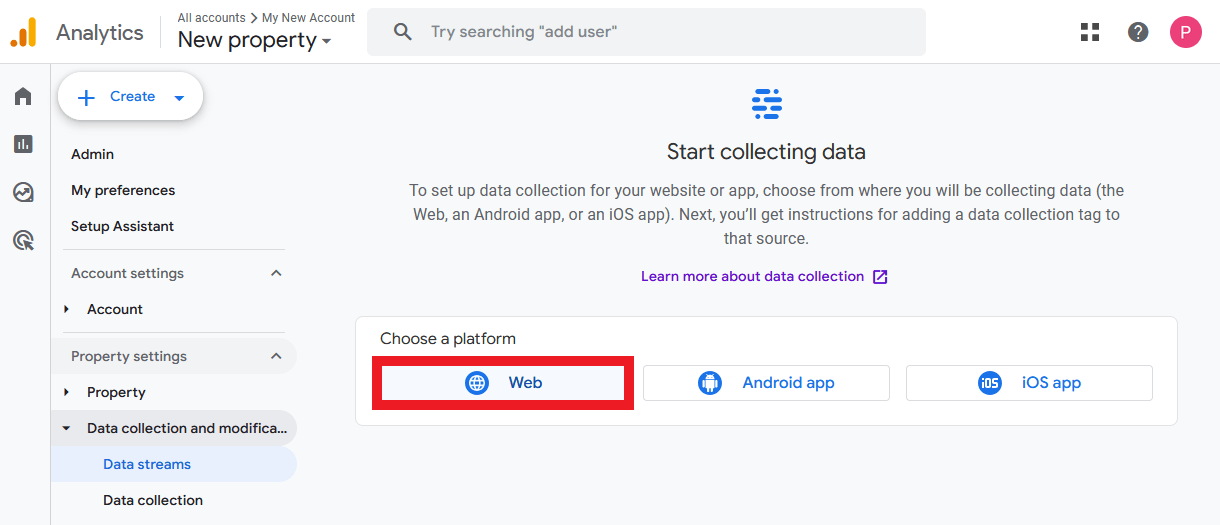
If you already have one or more Data Streams created for this property, the above option would look like this instead:
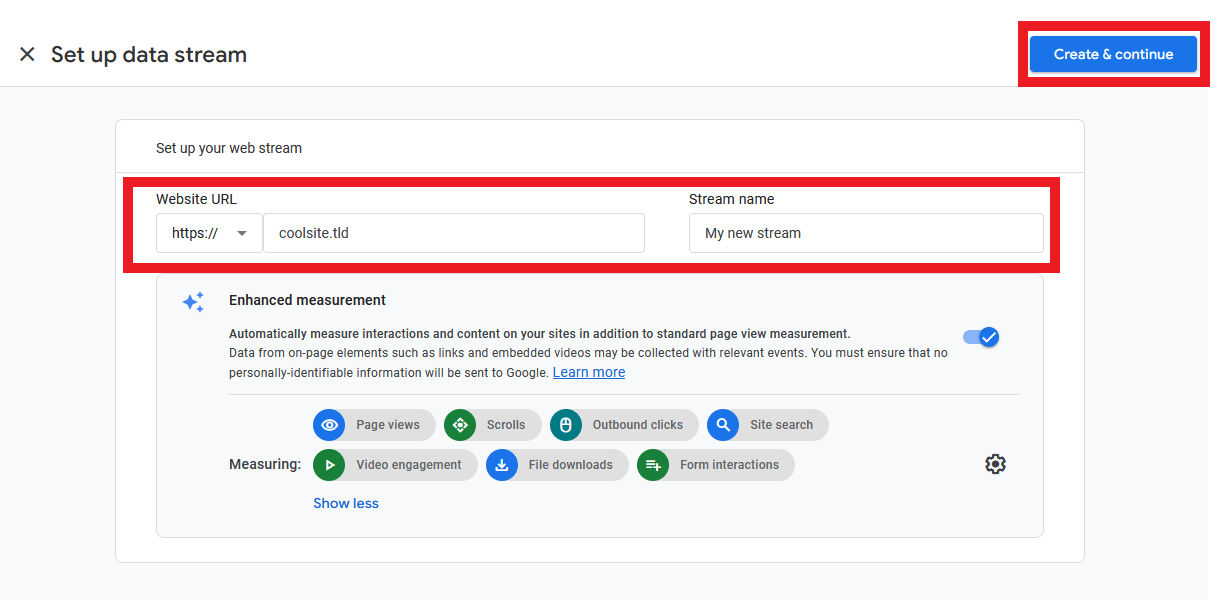
Then, on the Set Up screen that slides into view, ensure the correct protocol is selected (http/https) and enter your site’s domain name in the Website URL field, and enter a unique Stream Name for this stream. Enable the Enhanced Measurement option to get the most out of GA4, and click Create & continue.
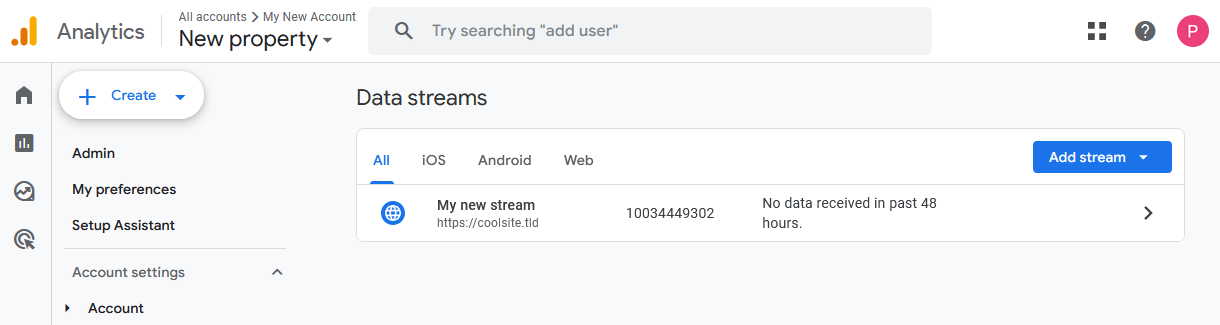
Once your Data Stream has been created, you’ll see it appear there in the Data Streams section, although the message there will of course say it hasn’t received any data yet.
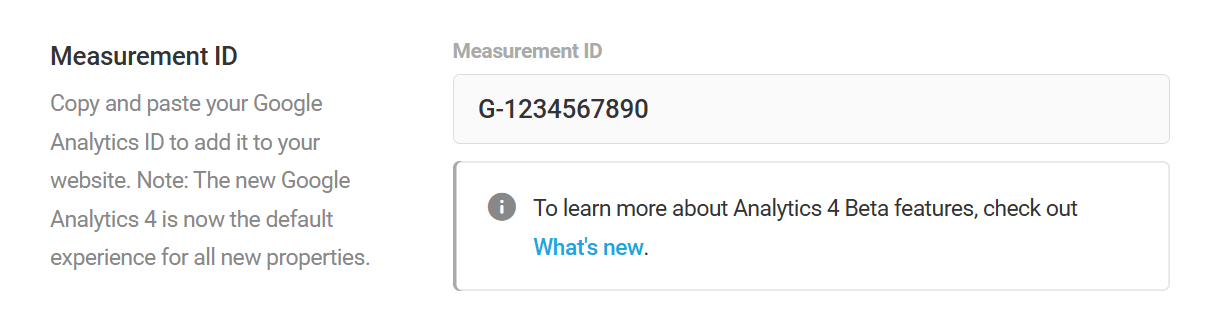
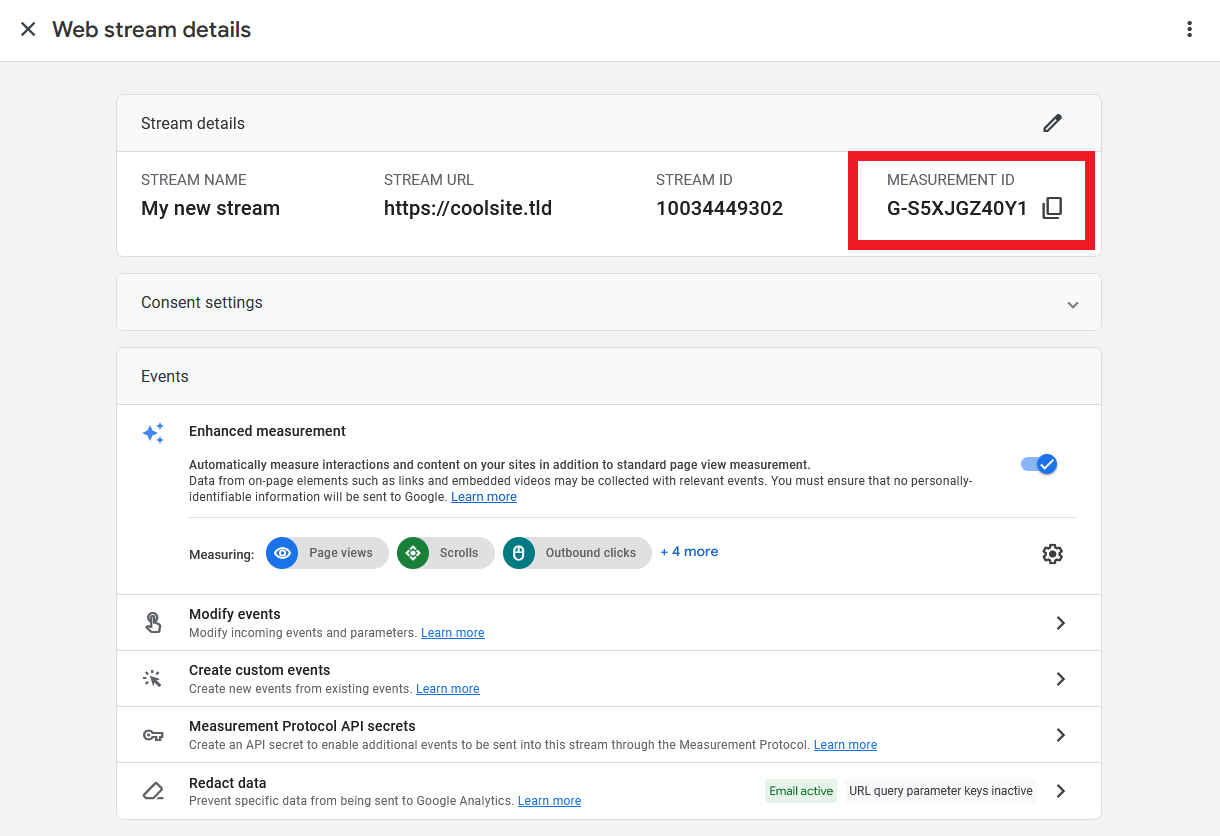
Measurement ID
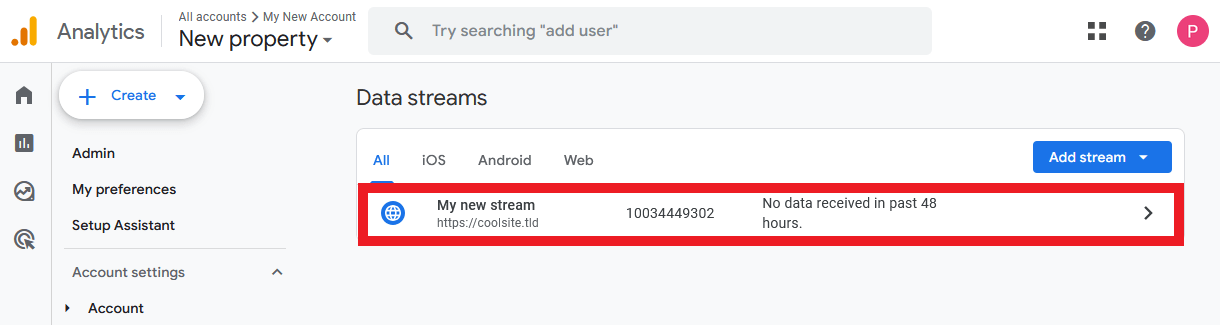
To locate the Measurement ID you need for your GA4 integration in Beehive, click on the Data Stream you want to use from your list.
Then, on the Web Stream Details screen that slides into view, you’ll see the Measurement ID at the top-right. Copy that and paste it in the corresponding field in your Beehive > Google Analytics > Account settings.
10.13 Scopes and Verification
Copy chapter anchor to clipboardWe do not recommend adding scopes to your Beehive API project. OAuth 2.0 verification is sufficient for the three scopes employed by Beehive and results in essentially immediate approval of your application by Google.
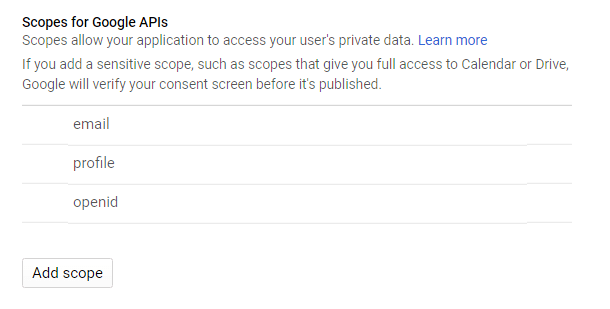
The data collected by Beehive requires three scopes:
userinfo.profile – Collects publicly available personal information.
userinfo.email – Collects users’ email addresses.
analytics.readonly – Shares analytics data with a client service which in this case is Beehive.
Adding scopes to your Beehive API project can broaden the type of data collected, but doing so may also trigger a higher verification standard that prevents immediate creation of the required credentials or places limits on Beehive until the verification process is complete. The verification process for highly sensitive scopes can take weeks.
10.14 Get Support
Copy chapter anchor to clipboardIf you still have questions or need assistance after reading this document, please don’t hesitate to contact our support superheroes using the available options under the Support tab in your Hub or via the Support tab in your WPMU DEV Dashboard.
